

162
4 The Dielectric Properties and Dynamic Structure of Water and Ice
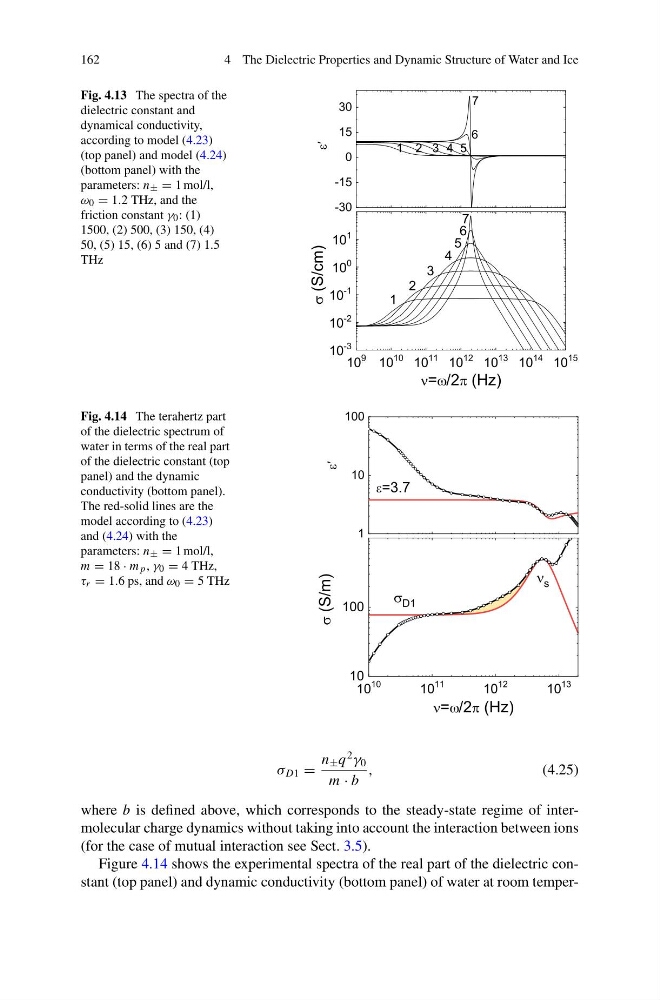
Fig. 4.13 The spectra of the
dielectric constant and
dynamical conductivity,
according to model (4.23)
(top panel) and model (4.24)
(bottom panel) with the
parameters: n ± = 1 mol/l,
ω 0 = 1.2 THz, and the
friction constant γ 0 : (1)
1500, (2) 500, (3) 150, (4)
50, (5) 15, (6) 5 and (7) 1.5
THz
Fig. 4.14 The terahertz part
of the dielectric spectrum of
water in terms of the real part
of the dielectric constant (top
panel) and the dynamic
conductivity (bottom panel).
The red-solid lines are the
model according to (4.23)
and (4.24) with the
parameters: n ± = 1 mol/l,
m = 18 · m p , γ 0 = 4 THz,
τ r = 1.6 ps, and ω 0 = 5 THz
σ D1 =
n ± q
2
γ 0
m · b
,
(4.25)
where b is defined above, which corresponds to the steady-state regime of intermolecular charge dynamics without taking into account the interaction between ions
(for the case of mutual interaction see Sect. 3.5).
Figure 4.14 shows the experimental spectra of the real part of the dielectric constant (top panel) and dynamic conductivity (bottom panel) of water at room temper-
4 The Dielectric Properties and Dynamic Structure of Water and Ice
Fig. 4.13 The spectra of the
dielectric constant and
dynamical conductivity,
according to model (4.23)
(top panel) and model (4.24)
(bottom panel) with the
parameters: n ± = 1 mol/l,
ω 0 = 1.2 THz, and the
friction constant γ 0 : (1)
1500, (2) 500, (3) 150, (4)
50, (5) 15, (6) 5 and (7) 1.5
THz
Fig. 4.14 The terahertz part
of the dielectric spectrum of
water in terms of the real part
of the dielectric constant (top
panel) and the dynamic
conductivity (bottom panel).
The red-solid lines are the
model according to (4.23)
and (4.24) with the
parameters: n ± = 1 mol/l,
m = 18 · m p , γ 0 = 4 THz,
τ r = 1.6 ps, and ω 0 = 5 THz
σ D1 =
n ± q
2
γ 0
m · b
,
(4.25)
where b is defined above, which corresponds to the steady-state regime of intermolecular charge dynamics without taking into account the interaction between ions
(for the case of mutual interaction see Sect. 3.5).
Figure 4.14 shows the experimental spectra of the real part of the dielectric constant (top panel) and dynamic conductivity (bottom panel) of water at room temper-