

4.2 A Phenomenological Model for the Broadband Dielectric Response
137
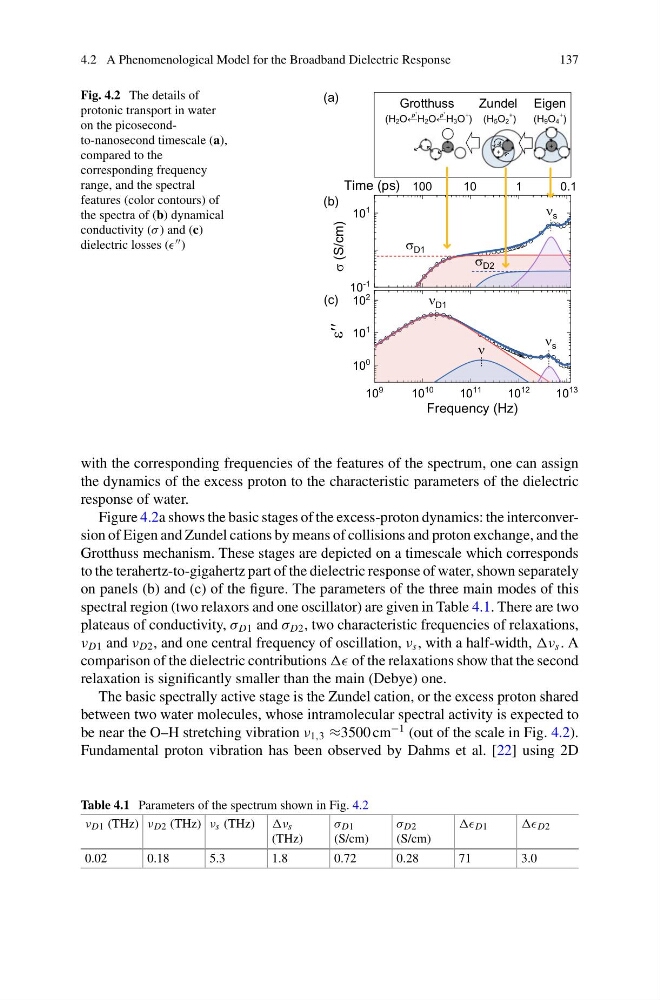
Fig. 4.2 The details of
protonic transport in water
on the picosecondto-nanosecond timescale (a),
compared to the
corresponding frequency
range, and the spectral
features (color contours) of
the spectra of (b) dynamical
conductivity (σ ) and (c)
dielectric losses ( )
10
-1
10
1
10
9
10
10
10
11
10
12
10
13
10
0
10
1
10
2
(S/cm)
D1
s
1
0.1
10
100
Time (ps)
Frequency (Hz)
s
D2
D1
D2
+
+
+
(H9O4
+
)
(H5O2
+
)
Grotthuss
Eigen
Zundel
(a)
(b)
(c)
(H2O←H2O←H3O
+
)
p +
p +
with the corresponding frequencies of the features of the spectrum, one can assign
the dynamics of the excess proton to the characteristic parameters of the dielectric
response of water.
Figure 4.2a shows the basic stages of the excess-proton dynamics: the interconversion of Eigen and Zundel cations by means of collisions and proton exchange, and the
Grotthuss mechanism. These stages are depicted on a timescale which corresponds
to the terahertz-to-gigahertz part of the dielectric response of water, shown separately
on panels (b) and (c) of the figure. The parameters of the three main modes of this
spectral region (two relaxors and one oscillator) are given in Table 4.1. There are two
plateaus of conductivity, σ D1 and σ D2 , two characteristic frequencies of relaxations,
ν D1 and ν D2 , and one central frequency of oscillation, ν s , with a half-width, s . A
comparison of the dielectric contributions of the relaxations show that the second
relaxation is significantly smaller than the main (Debye) one.
The basic spectrally active stage is the Zundel cation, or the excess proton shared
between two water molecules, whose intramolecular spectral activity is expected to
be near the O–H stretching vibration ν 1,3 ≈3500 cm
−1 (out of the scale in Fig. 4.2).
Fundamental proton vibration has been observed by Dahms et al. [22] using 2D
Table 4.1 Parameters of the spectrum shown in Fig. 4.2
ν D1 (THz) ν D2 (THz) ν s (THz) s
(THz)
σ D1
(S/cm)
σ D2
(S/cm)
D1
D2
0.02
0.18
5.3
1.8
0.72
0.28
71
3.0
137
Fig. 4.2 The details of
protonic transport in water
on the picosecondto-nanosecond timescale (a),
compared to the
corresponding frequency
range, and the spectral
features (color contours) of
the spectra of (b) dynamical
conductivity (σ ) and (c)
dielectric losses ( )
10
-1
10
1
10
9
10
10
10
11
10
12
10
13
10
0
10
1
10
2
(S/cm)
D1
s
1
0.1
10
100
Time (ps)
Frequency (Hz)
s
D2
D1
D2
+
+
+
(H9O4
+
)
(H5O2
+
)
Grotthuss
Eigen
Zundel
(a)
(b)
(c)
(H2O←H2O←H3O
+
)
p +
p +
with the corresponding frequencies of the features of the spectrum, one can assign
the dynamics of the excess proton to the characteristic parameters of the dielectric
response of water.
Figure 4.2a shows the basic stages of the excess-proton dynamics: the interconversion of Eigen and Zundel cations by means of collisions and proton exchange, and the
Grotthuss mechanism. These stages are depicted on a timescale which corresponds
to the terahertz-to-gigahertz part of the dielectric response of water, shown separately
on panels (b) and (c) of the figure. The parameters of the three main modes of this
spectral region (two relaxors and one oscillator) are given in Table 4.1. There are two
plateaus of conductivity, σ D1 and σ D2 , two characteristic frequencies of relaxations,
ν D1 and ν D2 , and one central frequency of oscillation, ν s , with a half-width, s . A
comparison of the dielectric contributions of the relaxations show that the second
relaxation is significantly smaller than the main (Debye) one.
The basic spectrally active stage is the Zundel cation, or the excess proton shared
between two water molecules, whose intramolecular spectral activity is expected to
be near the O–H stretching vibration ν 1,3 ≈3500 cm
−1 (out of the scale in Fig. 4.2).
Fundamental proton vibration has been observed by Dahms et al. [22] using 2D
Table 4.1 Parameters of the spectrum shown in Fig. 4.2
ν D1 (THz) ν D2 (THz) ν s (THz) s
(THz)
σ D1
(S/cm)
σ D2
(S/cm)
D1
D2
0.02
0.18
5.3
1.8
0.72
0.28
71
3.0