

34
Biomedical Signal and Image Processing
|H|
1
D 0
f
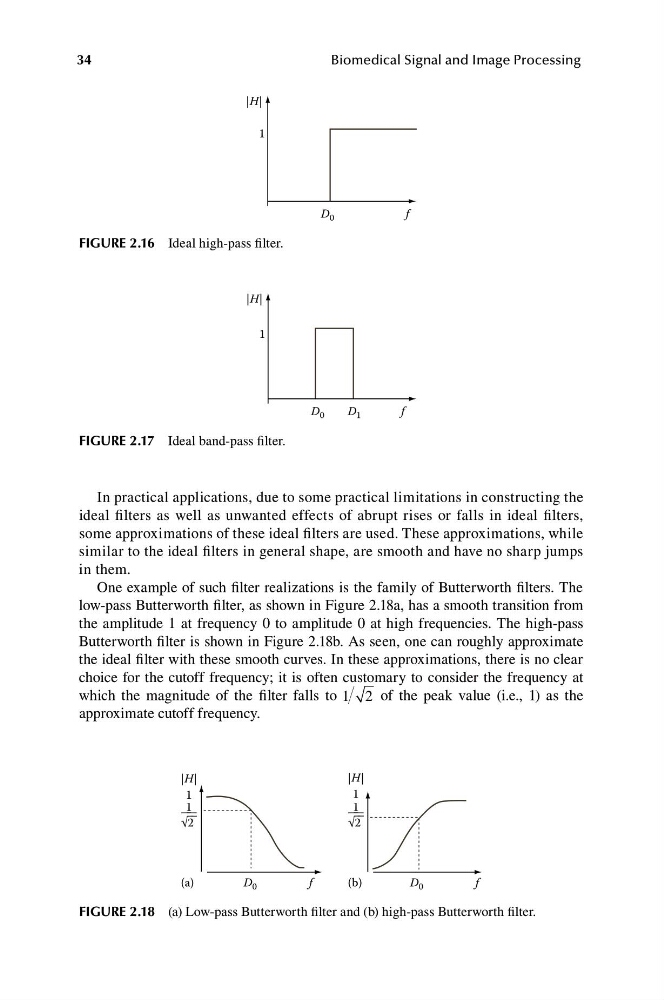
FIGURE 2.16 Ideal high-pass filter.
|H|
1
D 0
D 1
f
FIGURE 2.17 Ideal band-pass filter.
In practical applications, due to some practical limitations in constructing the
ideal filters as well as unwanted effects of abrupt rises or falls in ideal filters,
some approximations of these ideal filters are used. These approximations, while
similar to the ideal filters in general shape, are smooth and have no sharp jumps
in them.
One example of such filter realizations is the family of Butterworth filters. The
low-pass Butterworth filter, as shown in Figure 2.18a, has a smooth transition from
the amplitude 1 at frequency 0 to amplitude 0 at high frequencies. The high-pass
Butterworth filter is shown in Figure 2.18b. As seen, one can roughly approximate
the ideal filter with these smooth curves. In these approximations, there is no clear
choice for the cutoff frequency; it is often customary to consider the frequency at
which the magnitude of the filter falls to 1 2 of the peak value (i.e., 1) as the
approximate cutoff frequency.
|H|
|H|
1
1
1
1
— — – –
— — ––
√2
√2
(a)
D 0
f
(b)
D 0
f
FIGURE 2.18 (a) Low-pass Butterworth filter and (b) high-pass Butterworth filter.
Biomedical Signal and Image Processing
|H|
1
D 0
f
FIGURE 2.16 Ideal high-pass filter.
|H|
1
D 0
D 1
f
FIGURE 2.17 Ideal band-pass filter.
In practical applications, due to some practical limitations in constructing the
ideal filters as well as unwanted effects of abrupt rises or falls in ideal filters,
some approximations of these ideal filters are used. These approximations, while
similar to the ideal filters in general shape, are smooth and have no sharp jumps
in them.
One example of such filter realizations is the family of Butterworth filters. The
low-pass Butterworth filter, as shown in Figure 2.18a, has a smooth transition from
the amplitude 1 at frequency 0 to amplitude 0 at high frequencies. The high-pass
Butterworth filter is shown in Figure 2.18b. As seen, one can roughly approximate
the ideal filter with these smooth curves. In these approximations, there is no clear
choice for the cutoff frequency; it is often customary to consider the frequency at
which the magnitude of the filter falls to 1 2 of the peak value (i.e., 1) as the
approximate cutoff frequency.
|H|
|H|
1
1
1
1
— — – –
— — ––
√2
√2
(a)
D 0
f
(b)
D 0
f
FIGURE 2.18 (a) Low-pass Butterworth filter and (b) high-pass Butterworth filter.