

303
Magnetic Resonance Imaging
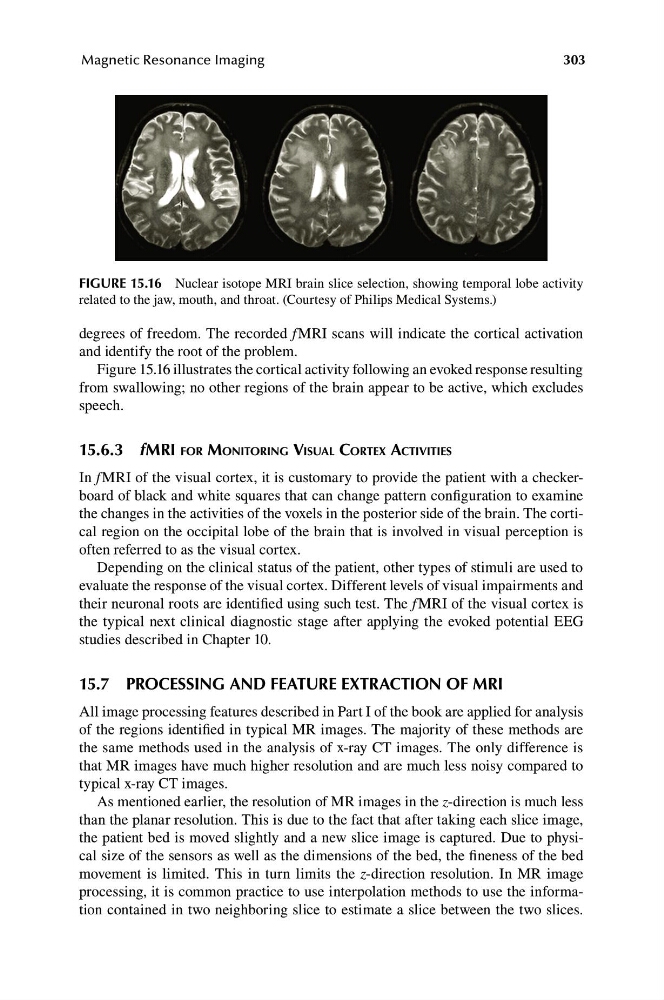
FIGURE 15.16 Nuclear isotope MRI brain slice selection, showing temporal lobe activity
related to the jaw, mouth, and throat. (Courtesy of Philips Medical Systems.)
degrees of freedom. The recorded f MRI scans will indicate the cortical activation
and identify the root of the problem.
Figure 15.16 illustrates the cortical activity following an evoked response resulting
from swallowing; no other regions of the brain appear to be active, which excludes
speech.
15.6.3 fMRI FOR MONITORING VISUAL CORTEX ACTIVITIES
In f MRI of the visual cortex, it is customary to provide the patient with a checkerboard of black and white squares that can change pattern configuration to examine
the changes in the activities of the voxels in the posterior side of the brain. The cortical region on the occipital lobe of the brain that is involved in visual perception is
often referred to as the visual cortex.
Depending on the clinical status of the patient, other types of stimuli are used to
evaluate the response of the visual cortex. Different levels of visual impairments and
their neuronal roots are identified using such test. The f MRI of the visual cortex is
the typical next clinical diagnostic stage after applying the evoked potential EEG
studies described in Chapter 10.
15.7 PROCESSING AND FEATURE EXTRACTION OF MRI
All image processing features described in Part I of the book are applied for analysis
of the regions identified in typical MR images. The majority of these methods are
the same methods used in the analysis of x-ray CT images. The only difference is
that MR images have much higher resolution and are much less noisy compared to
typical x-ray CT images.
As mentioned earlier, the resolution of MR images in the z-direction is much less
than the planar resolution. This is due to the fact that after taking each slice image,
the patient bed is moved slightly and a new slice image is captured. Due to physical size of the sensors as well as the dimensions of the bed, the fineness of the bed
movement is limited. This in turn limits the z-direction resolution. In MR image
processing, it is common practice to use interpolation methods to use the information contained in two neighboring slice to estimate a slice between the two slices.
Magnetic Resonance Imaging
FIGURE 15.16 Nuclear isotope MRI brain slice selection, showing temporal lobe activity
related to the jaw, mouth, and throat. (Courtesy of Philips Medical Systems.)
degrees of freedom. The recorded f MRI scans will indicate the cortical activation
and identify the root of the problem.
Figure 15.16 illustrates the cortical activity following an evoked response resulting
from swallowing; no other regions of the brain appear to be active, which excludes
speech.
15.6.3 fMRI FOR MONITORING VISUAL CORTEX ACTIVITIES
In f MRI of the visual cortex, it is customary to provide the patient with a checkerboard of black and white squares that can change pattern configuration to examine
the changes in the activities of the voxels in the posterior side of the brain. The cortical region on the occipital lobe of the brain that is involved in visual perception is
often referred to as the visual cortex.
Depending on the clinical status of the patient, other types of stimuli are used to
evaluate the response of the visual cortex. Different levels of visual impairments and
their neuronal roots are identified using such test. The f MRI of the visual cortex is
the typical next clinical diagnostic stage after applying the evoked potential EEG
studies described in Chapter 10.
15.7 PROCESSING AND FEATURE EXTRACTION OF MRI
All image processing features described in Part I of the book are applied for analysis
of the regions identified in typical MR images. The majority of these methods are
the same methods used in the analysis of x-ray CT images. The only difference is
that MR images have much higher resolution and are much less noisy compared to
typical x-ray CT images.
As mentioned earlier, the resolution of MR images in the z-direction is much less
than the planar resolution. This is due to the fact that after taking each slice image,
the patient bed is moved slightly and a new slice image is captured. Due to physical size of the sensors as well as the dimensions of the bed, the fineness of the bed
movement is limited. This in turn limits the z-direction resolution. In MR image
processing, it is common practice to use interpolation methods to use the information contained in two neighboring slice to estimate a slice between the two slices.