

212
C h a n n e ls
EEG readings (control)
30
20
10
0
–10
–20
–30
70
1
60
50
40
30
10
0.2
0.6
0.8
Ti m e (s )
20
0.4
60
50
40
Voltage (mV)
0 0
Biomedical Signal and Image Processing
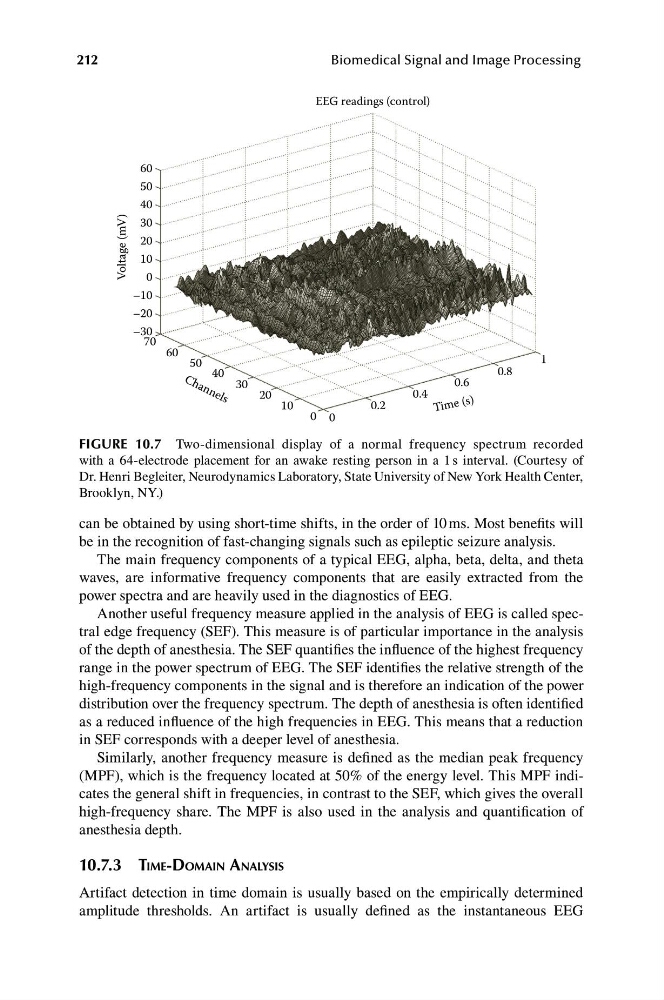
FIGURE 10.7 Two-dimensional display of a normal frequency spectrum recorded
with a 64-electrode placement for an awake resting person in a 1 s interval. (Courtesy of
Dr. Henri Begleiter, Neurodynamics Laboratory, State University of New York Health Center,
Brooklyn, NY.)
can be obtained by using short-time shifts, in the order of 10 ms. Most benefits will
be in the recognition of fast-changing signals such as epileptic seizure analysis.
The main frequency components of a typical EEG, alpha, beta, delta, and theta
waves, are informative frequency components that are easily extracted from the
power spectra and are heavily used in the diagnostics of EEG.
Another useful frequency measure applied in the analysis of EEG is called spectral edge frequency (SEF). This measure is of particular importance in the analysis
of the depth of anesthesia. The SEF quantifies the influence of the highest frequency
range in the power spectrum of EEG. The SEF identifies the relative strength of the
high-frequency components in the signal and is therefore an indication of the power
distribution over the frequency spectrum. The depth of anesthesia is often identified
as a reduced influence of the high frequencies in EEG. This means that a reduction
in SEF corresponds with a deeper level of anesthesia.
Similarly, another frequency measure is defined as the median peak frequency
(MPF), which is the frequency located at 50% of the energy level. This MPF indicates the general shift in frequencies, in contrast to the SEF, which gives the overall
high-frequency share. The MPF is also used in the analysis and quantification of
anesthesia depth.
10.7.3 TIME-DOMAIN ANALYSIS
Artifact detection in time domain is usually based on the empirically determined
amplitude thresholds. An artifact is usually defined as the instantaneous EEG
C h a n n e ls
EEG readings (control)
30
20
10
0
–10
–20
–30
70
1
60
50
40
30
10
0.2
0.6
0.8
Ti m e (s )
20
0.4
60
50
40
Voltage (mV)
0 0
Biomedical Signal and Image Processing
FIGURE 10.7 Two-dimensional display of a normal frequency spectrum recorded
with a 64-electrode placement for an awake resting person in a 1 s interval. (Courtesy of
Dr. Henri Begleiter, Neurodynamics Laboratory, State University of New York Health Center,
Brooklyn, NY.)
can be obtained by using short-time shifts, in the order of 10 ms. Most benefits will
be in the recognition of fast-changing signals such as epileptic seizure analysis.
The main frequency components of a typical EEG, alpha, beta, delta, and theta
waves, are informative frequency components that are easily extracted from the
power spectra and are heavily used in the diagnostics of EEG.
Another useful frequency measure applied in the analysis of EEG is called spectral edge frequency (SEF). This measure is of particular importance in the analysis
of the depth of anesthesia. The SEF quantifies the influence of the highest frequency
range in the power spectrum of EEG. The SEF identifies the relative strength of the
high-frequency components in the signal and is therefore an indication of the power
distribution over the frequency spectrum. The depth of anesthesia is often identified
as a reduced influence of the high frequencies in EEG. This means that a reduction
in SEF corresponds with a deeper level of anesthesia.
Similarly, another frequency measure is defined as the median peak frequency
(MPF), which is the frequency located at 50% of the energy level. This MPF indicates the general shift in frequencies, in contrast to the SEF, which gives the overall
high-frequency share. The MPF is also used in the analysis and quantification of
anesthesia depth.
10.7.3 TIME-DOMAIN ANALYSIS
Artifact detection in time domain is usually based on the empirically determined
amplitude thresholds. An artifact is usually defined as the instantaneous EEG