

×
x 2
x 2
Red
Blue
× ×
×
Green
x 1
(a)
x 1
(b)
x 2
x 2
Green
×
Red
Red
×
×
×
×
×
Blue
Blue
Green
x 1
(c)
x 1
(d)
x 2
x 2
Green
×
Green
×
× Blue
× Red
× Blue
Red
(e)
x 1
(f )
x 1
132
Biomedical Signal and Image Processing
Step 4: If during the last iteration, no example has changed its class, go to Step 5;
otherwise, go to Step 2.
Step 5: Terminate process. The final clusters are the outputs of the algorithm.
The concept of K-means clustering is better described in the following simple visual
example.
Example 7.2
In this example, without using any mathematics or calculations, we explore the
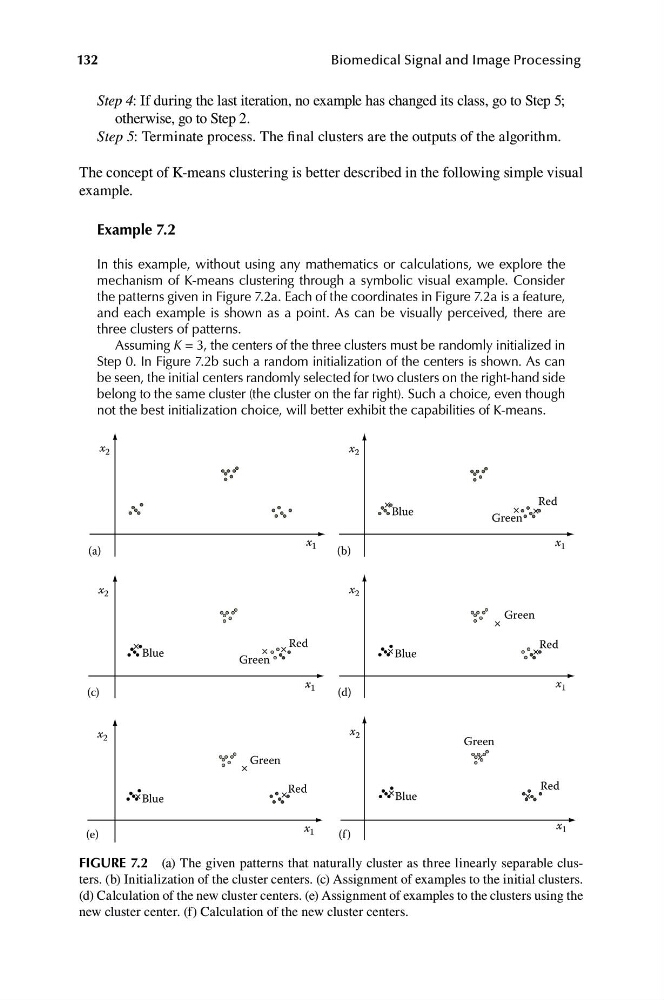
mechanism of K-means clustering through a symbolic visual example. Consider
the patterns given in Figure 7.2a. Each of the coordinates in Figure 7.2a is a feature,
and each example is shown as a point. As can be visually perceived, there are
three clusters of patterns.
Assuming K = 3, the centers of the three clusters must be randomly initialized in
Step 0. In Figure 7.2b such a random initialization of the centers is shown. As can
be seen, the initial centers randomly selected for two clusters on the right-hand side
belong to the same cluster (the cluster on the far right). Such a choice, even though
not the best initialization choice, will better exhibit the capabilities of K-means.
FIGURE 7.2 (a) The given patterns that naturally cluster as three linearly separable clusters. (b) Initialization of the cluster centers. (c) Assignment of examples to the initial clusters.
(d) Calculation of the new cluster centers. (e) Assignment of examples to the clusters using the
new cluster center. (f) Calculation of the new cluster centers.
x 2
x 2
Red
Blue
× ×
×
Green
x 1
(a)
x 1
(b)
x 2
x 2
Green
×
Red
Red
×
×
×
×
×
Blue
Blue
Green
x 1
(c)
x 1
(d)
x 2
x 2
Green
×
Green
×
× Blue
× Red
× Blue
Red
(e)
x 1
(f )
x 1
132
Biomedical Signal and Image Processing
Step 4: If during the last iteration, no example has changed its class, go to Step 5;
otherwise, go to Step 2.
Step 5: Terminate process. The final clusters are the outputs of the algorithm.
The concept of K-means clustering is better described in the following simple visual
example.
Example 7.2
In this example, without using any mathematics or calculations, we explore the
mechanism of K-means clustering through a symbolic visual example. Consider
the patterns given in Figure 7.2a. Each of the coordinates in Figure 7.2a is a feature,
and each example is shown as a point. As can be visually perceived, there are
three clusters of patterns.
Assuming K = 3, the centers of the three clusters must be randomly initialized in
Step 0. In Figure 7.2b such a random initialization of the centers is shown. As can
be seen, the initial centers randomly selected for two clusters on the right-hand side
belong to the same cluster (the cluster on the far right). Such a choice, even though
not the best initialization choice, will better exhibit the capabilities of K-means.
FIGURE 7.2 (a) The given patterns that naturally cluster as three linearly separable clusters. (b) Initialization of the cluster centers. (c) Assignment of examples to the initial clusters.
(d) Calculation of the new cluster centers. (e) Assignment of examples to the clusters using the
new cluster center. (f) Calculation of the new cluster centers.