

74
Biomedical Signal and Image Processing
12,000
10,000
8,000
6,000
4,000
2,000
0
(a)
(b) 0
50
100
150
200
250
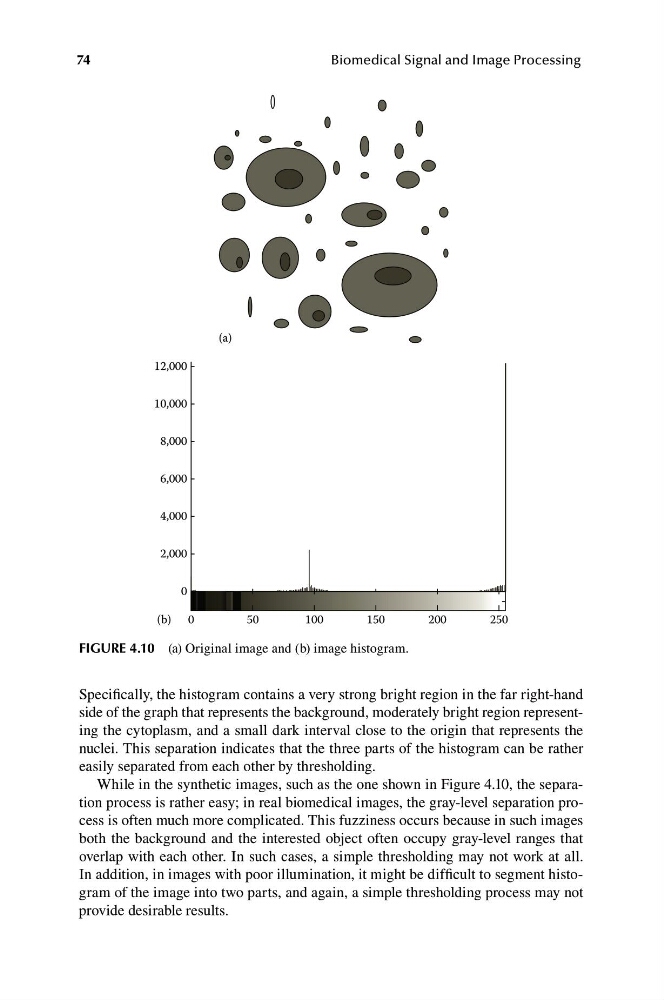
FIGURE 4.10 (a) Original image and (b) image histogram.
Specifically, the histogram contains a very strong bright region in the far right-hand
side of the graph that represents the background, moderately bright region representing the cytoplasm, and a small dark interval close to the origin that represents the
nuclei. This separation indicates that the three parts of the histogram can be rather
easily separated from each other by thresholding.
While in the synthetic images, such as the one shown in Figure 4.10, the separation process is rather easy; in real biomedical images, the gray-level separation process is often much more complicated. This fuzziness occurs because in such images
both the background and the interested object often occupy gray-level ranges that
overlap with each other. In such cases, a simple thresholding may not work at all.
In addition, in images with poor illumination, it might be difficult to segment histogram of the image into two parts, and again, a simple thresholding process may not
provide desirable results.
Biomedical Signal and Image Processing
12,000
10,000
8,000
6,000
4,000
2,000
0
(a)
(b) 0
50
100
150
200
250
FIGURE 4.10 (a) Original image and (b) image histogram.
Specifically, the histogram contains a very strong bright region in the far right-hand
side of the graph that represents the background, moderately bright region representing the cytoplasm, and a small dark interval close to the origin that represents the
nuclei. This separation indicates that the three parts of the histogram can be rather
easily separated from each other by thresholding.
While in the synthetic images, such as the one shown in Figure 4.10, the separation process is rather easy; in real biomedical images, the gray-level separation process is often much more complicated. This fuzziness occurs because in such images
both the background and the interested object often occupy gray-level ranges that
overlap with each other. In such cases, a simple thresholding may not work at all.
In addition, in images with poor illumination, it might be difficult to segment histogram of the image into two parts, and again, a simple thresholding process may not
provide desirable results.