

directly further processed in the algae biorefinery module on the central platform.
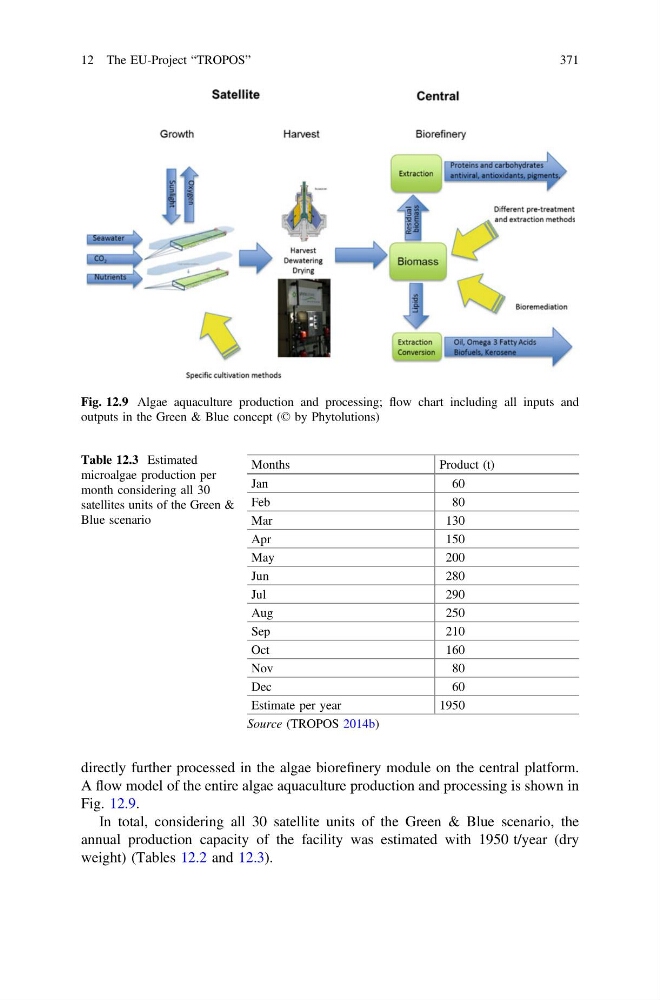
A flow model of the entire algae aquaculture production and processing is shown in
Fig. 12.9.
In total, considering all 30 satellite units of the Green & Blue scenario, the
annual production capacity of the facility was estimated with 1950 t/year (dry
weight) (Tables 12.2 and 12.3).
Fig. 12.9 Algae aquaculture production and processing; flow chart including all inputs and
outputs in the Green & Blue concept (© by Phytolutions)
Table 12.3 Estimated
microalgae production per
month considering all 30
satellites units of the Green &
Blue scenario
Months
Product (t)
Jan
60
Feb
80
Mar
130
Apr
150
May
200
Jun
280
Jul
290
Aug
250
Sep
210
Oct
160
Nov
80
Dec
60
Estimate per year
1950
Source (TROPOS 2014b)
12 The EU-Project “TROPOS”
371
A flow model of the entire algae aquaculture production and processing is shown in
Fig. 12.9.
In total, considering all 30 satellite units of the Green & Blue scenario, the
annual production capacity of the facility was estimated with 1950 t/year (dry
weight) (Tables 12.2 and 12.3).
Fig. 12.9 Algae aquaculture production and processing; flow chart including all inputs and
outputs in the Green & Blue concept (© by Phytolutions)
Table 12.3 Estimated
microalgae production per
month considering all 30
satellites units of the Green &
Blue scenario
Months
Product (t)
Jan
60
Feb
80
Mar
130
Apr
150
May
200
Jun
280
Jul
290
Aug
250
Sep
210
Oct
160
Nov
80
Dec
60
Estimate per year
1950
Source (TROPOS 2014b)
12 The EU-Project “TROPOS”
371