

the vertical reactions in a beam were a half of the applied load and for a theoretic
cable the reactions were infinite.
In the following graph, the theoretical and simulated values for the relative force
were shown as a function of the relative maximum sag h/l. The relative maximum
sag h/l was the ratio of the maximum sag to total distance between the supports
(Fig. 11.27a). The theoretical values for h were based on curve length of the
pre-deformed model. The curve length was then used to get the maximum sag of the
foreseen V-form after loading. That value of h was then used with the formula
described above. The theoretical and simulated values for the relative force are
shown in Fig. 11.27a, b.
With values for h/l bigger than 0.05 the relative force was smaller than 4 and was
approaching 1 with increasing h/l ratio at nearly 0.25. The more the longline was
tightened and the h/l ratio was decreasing the numerical model of the longline
shows an increasing relative force in the supports. In Fig. 11.28a the pre-deformed
model is shown and the deformed model under single load depicted as an arrow is
also sketched. The deformed model had a V-form similarly to the theoretical cable
under the same loading. The second parametric study for different angles of attack
and different maximal sags is shown (Fig. 11.28b). As an example the deformed
and not deformed model of a longline loaded at equally spaced points with a
loading angle of 60° is shown in Fig. 11.28b. The forces are depicted separately in
their coordinate direction components. In the middle part smaller loads represent
the single mussel collectors whereas the rest represents V-collectors. A deformation
of the LL model in force direction was observed. Figure 11.28c shows the results
for the second parametric study. The relative force in the right and left support was
calculated for different values of angle of attack and varying maximal sags. In this
case the relative force was the reaction at the end of the longline divided by the sum
of total collector forces that were applied. In general the reactions in the left support
were bigger than in the right except for angles of 90° where the loading was
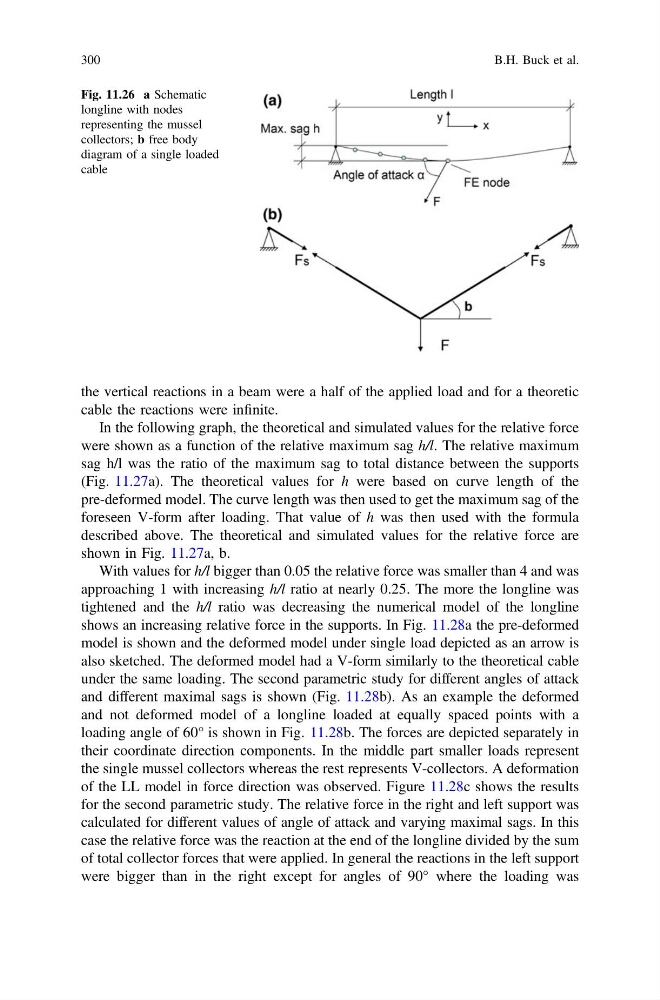
Fig. 11.26 a Schematic
longline with nodes
representing the mussel
collectors; b free body
diagram of a single loaded
cable
300
B.H. Buck et al.
cable the reactions were infinite.
In the following graph, the theoretical and simulated values for the relative force
were shown as a function of the relative maximum sag h/l. The relative maximum
sag h/l was the ratio of the maximum sag to total distance between the supports
(Fig. 11.27a). The theoretical values for h were based on curve length of the
pre-deformed model. The curve length was then used to get the maximum sag of the
foreseen V-form after loading. That value of h was then used with the formula
described above. The theoretical and simulated values for the relative force are
shown in Fig. 11.27a, b.
With values for h/l bigger than 0.05 the relative force was smaller than 4 and was
approaching 1 with increasing h/l ratio at nearly 0.25. The more the longline was
tightened and the h/l ratio was decreasing the numerical model of the longline
shows an increasing relative force in the supports. In Fig. 11.28a the pre-deformed
model is shown and the deformed model under single load depicted as an arrow is
also sketched. The deformed model had a V-form similarly to the theoretical cable
under the same loading. The second parametric study for different angles of attack
and different maximal sags is shown (Fig. 11.28b). As an example the deformed
and not deformed model of a longline loaded at equally spaced points with a
loading angle of 60° is shown in Fig. 11.28b. The forces are depicted separately in
their coordinate direction components. In the middle part smaller loads represent
the single mussel collectors whereas the rest represents V-collectors. A deformation
of the LL model in force direction was observed. Figure 11.28c shows the results
for the second parametric study. The relative force in the right and left support was
calculated for different values of angle of attack and varying maximal sags. In this
case the relative force was the reaction at the end of the longline divided by the sum
of total collector forces that were applied. In general the reactions in the left support
were bigger than in the right except for angles of 90° where the loading was
Fig. 11.26 a Schematic
longline with nodes
representing the mussel
collectors; b free body
diagram of a single loaded
cable
300
B.H. Buck et al.