

resolution of 9.26 km
2 . A GIS-MCE technique was applied to index suitable
co-sites. In order to provide all criteria needed (Fig. 6.2), hydrographic data were
extracted, analysed and interpolated to derive depth stratified mean values per
quarter of the year. Further all data were standardised using fuzzy membership
functions with control points to guarantee comparability among factors, whereby
the choice of function and control points was based on expert knowledge and
literature research. With the pairwise comparison method of the Analytical
Hierarchy Process (AHP) all factors were weighted by priority for all grid cells.
Also a range of weighting designs was modelled using an Ordered Weighted
Average (OWA) approach to address the uncertainty in prediction results. If one
grid cell appeared to be unsuitable during OWA weighting, it had been excluded
from further assessments. The final weighting of the factors was based on expert
judgement and focused on the optimal growth under farmed conditions. Using this
weighting scheme the GIS-MCE resulted in a series of geo-referenced aquaculture
suitability layers comprising the whole German EEZ of the North Sea. In a next
step, an offshore co-location suitability index was developed by accounting for
overlaps between the aquaculture sites and referenced offshore wind farms provided
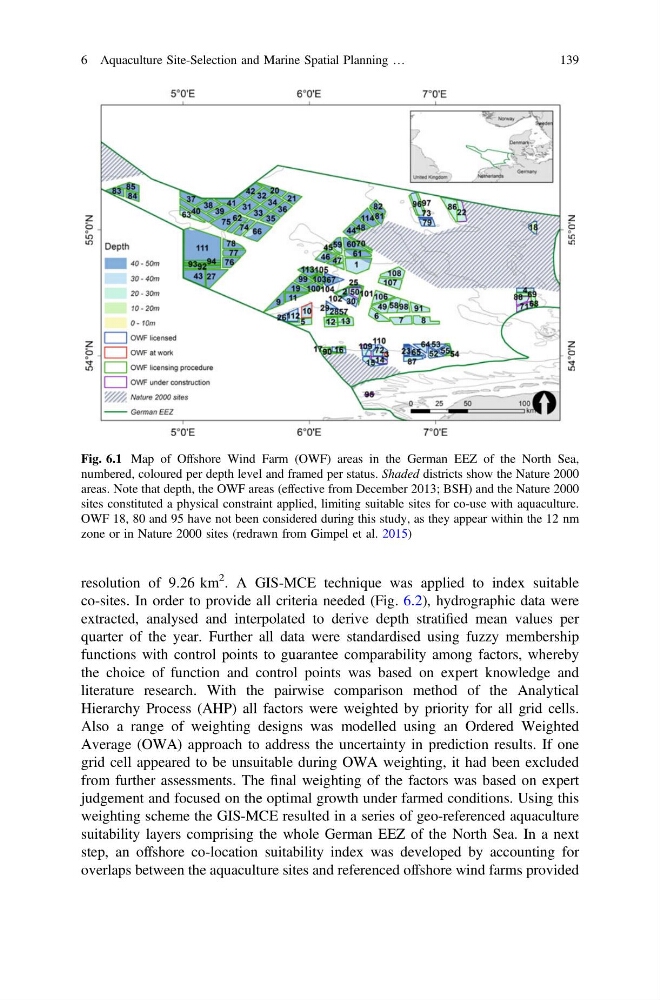
Fig. 6.1 Map of Offshore Wind Farm (OWF) areas in the German EEZ of the North Sea,
numbered, coloured per depth level and framed per status. Shaded districts show the Nature 2000
areas. Note that depth, the OWF areas (effective from December 2013; BSH) and the Nature 2000
sites constituted a physical constraint applied, limiting suitable sites for co-use with aquaculture.
OWF 18, 80 and 95 have not been considered during this study, as they appear within the 12 nm
zone or in Nature 2000 sites (redrawn from Gimpel et al. 2015)
6 Aquaculture Site-Selection and Marine Spatial Planning …
139
2 . A GIS-MCE technique was applied to index suitable
co-sites. In order to provide all criteria needed (Fig. 6.2), hydrographic data were
extracted, analysed and interpolated to derive depth stratified mean values per
quarter of the year. Further all data were standardised using fuzzy membership
functions with control points to guarantee comparability among factors, whereby
the choice of function and control points was based on expert knowledge and
literature research. With the pairwise comparison method of the Analytical
Hierarchy Process (AHP) all factors were weighted by priority for all grid cells.
Also a range of weighting designs was modelled using an Ordered Weighted
Average (OWA) approach to address the uncertainty in prediction results. If one
grid cell appeared to be unsuitable during OWA weighting, it had been excluded
from further assessments. The final weighting of the factors was based on expert
judgement and focused on the optimal growth under farmed conditions. Using this
weighting scheme the GIS-MCE resulted in a series of geo-referenced aquaculture
suitability layers comprising the whole German EEZ of the North Sea. In a next
step, an offshore co-location suitability index was developed by accounting for
overlaps between the aquaculture sites and referenced offshore wind farms provided
Fig. 6.1 Map of Offshore Wind Farm (OWF) areas in the German EEZ of the North Sea,
numbered, coloured per depth level and framed per status. Shaded districts show the Nature 2000
areas. Note that depth, the OWF areas (effective from December 2013; BSH) and the Nature 2000
sites constituted a physical constraint applied, limiting suitable sites for co-use with aquaculture.
OWF 18, 80 and 95 have not been considered during this study, as they appear within the 12 nm
zone or in Nature 2000 sites (redrawn from Gimpel et al. 2015)
6 Aquaculture Site-Selection and Marine Spatial Planning …
139