

Table 4.1 Cost share (in % of total O&M costs) and explanation of the different O&M disciplines
in the total life cycle management of offshore wind farms (Miedema 2012)
Operations (11%)
In this distribution ‘Operations’ purely deals with the
primary process; by moving 3% to ‘Life Cycle Management’
(LCM) and 6% to ‘Inspective Maintenance’, ‘Operations’
(usually 20%; Fig. 4.2) is reduced to 11%
Life cycle
management (7%)
‘Life Cycle Management’ (LCM) is used for the benefit of
both operations and maintenance. LCM takes care of
maintenance schedules and planning (3%) and covers
activities that are normally housed under ‘Maintenance’
(Fig. 4.2), thereby leading to a transfer of 4% from
‘Maintenance’ to ‘LCM’
Inspective (10%),
preventive (12%), corrective
(35%) maintenance
The overall activity ‘Maintenance’ (usually 80%; Fig. 4.2)
is split up into three specific maintenance types and
‘Improvement’, which covers refit, overhauls and
modification programs.
‘Inspective Maintenance’ is often seen as an operational
activity or part of preventive maintenance. In this study it is
recognized as a specific maintenance type with a total share
of 10%, composed of 6% ‘Operations’ and 4%
‘Maintenance’ (Fig. 4.2).
Although most studies apply a preventive/corrective
maintenance ratio of app. 1:2, in this study it is this set at
app. 1:3, because inspective maintenance is usually
considered to be part of preventive maintenance
a .
Improvement (25%)
Total O&M cost includes refits, major overhauls and
modifications, to maintain optimal performance of the wind
farm. With a total O&M cost distribution of 21–34 €/MWh,
the share of ‘Improvement’ O&M is set at 25%
a According to Rademakers and Braam (2002), the preventive maintenance cost dispersion is 3–6
€/MWh, where the corrective cost dispersion is 5–10 €/MWh
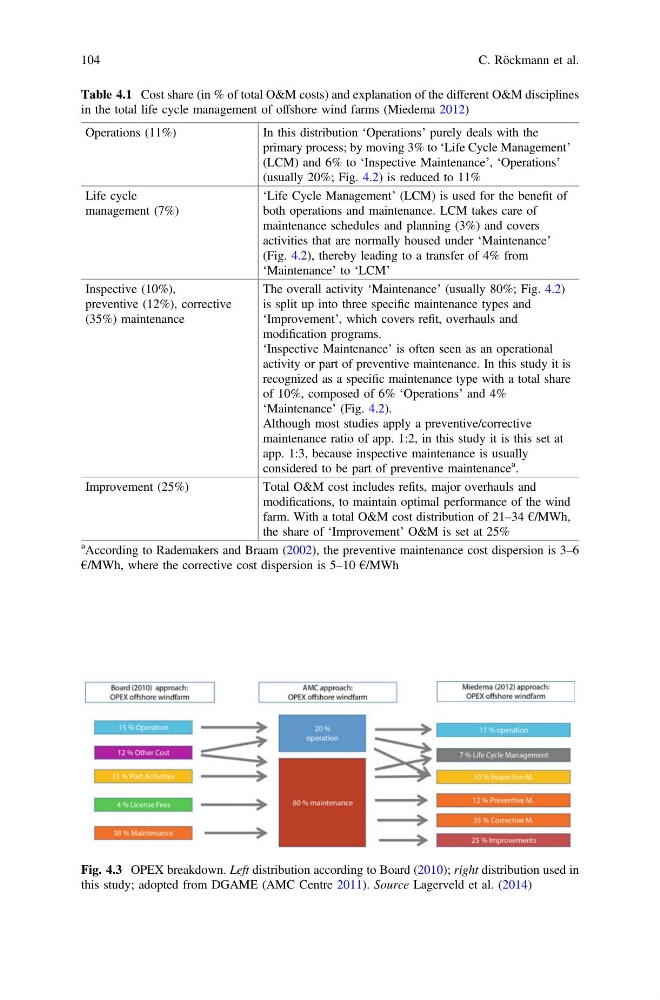
Fig. 4.3 OPEX breakdown. Left distribution according to Board (2010); right distribution used in
this study; adopted from DGAME (AMC Centre 2011). Source Lagerveld et al. (2014)
104
C. Röckmann et al.
in the total life cycle management of offshore wind farms (Miedema 2012)
Operations (11%)
In this distribution ‘Operations’ purely deals with the
primary process; by moving 3% to ‘Life Cycle Management’
(LCM) and 6% to ‘Inspective Maintenance’, ‘Operations’
(usually 20%; Fig. 4.2) is reduced to 11%
Life cycle
management (7%)
‘Life Cycle Management’ (LCM) is used for the benefit of
both operations and maintenance. LCM takes care of
maintenance schedules and planning (3%) and covers
activities that are normally housed under ‘Maintenance’
(Fig. 4.2), thereby leading to a transfer of 4% from
‘Maintenance’ to ‘LCM’
Inspective (10%),
preventive (12%), corrective
(35%) maintenance
The overall activity ‘Maintenance’ (usually 80%; Fig. 4.2)
is split up into three specific maintenance types and
‘Improvement’, which covers refit, overhauls and
modification programs.
‘Inspective Maintenance’ is often seen as an operational
activity or part of preventive maintenance. In this study it is
recognized as a specific maintenance type with a total share
of 10%, composed of 6% ‘Operations’ and 4%
‘Maintenance’ (Fig. 4.2).
Although most studies apply a preventive/corrective
maintenance ratio of app. 1:2, in this study it is this set at
app. 1:3, because inspective maintenance is usually
considered to be part of preventive maintenance
a .
Improvement (25%)
Total O&M cost includes refits, major overhauls and
modifications, to maintain optimal performance of the wind
farm. With a total O&M cost distribution of 21–34 €/MWh,
the share of ‘Improvement’ O&M is set at 25%
a According to Rademakers and Braam (2002), the preventive maintenance cost dispersion is 3–6
€/MWh, where the corrective cost dispersion is 5–10 €/MWh
Fig. 4.3 OPEX breakdown. Left distribution according to Board (2010); right distribution used in
this study; adopted from DGAME (AMC Centre 2011). Source Lagerveld et al. (2014)
104
C. Röckmann et al.