

pipe, bolted to a manifold on the bottom of the buoy. They extended from the buoy
to the submerged grid approximately 200 m away. Individual feed lines then
integrated into the grid system and on to the top of each cage. Video cameras inside
the cages were cabled through the feed lines back to the buoy.
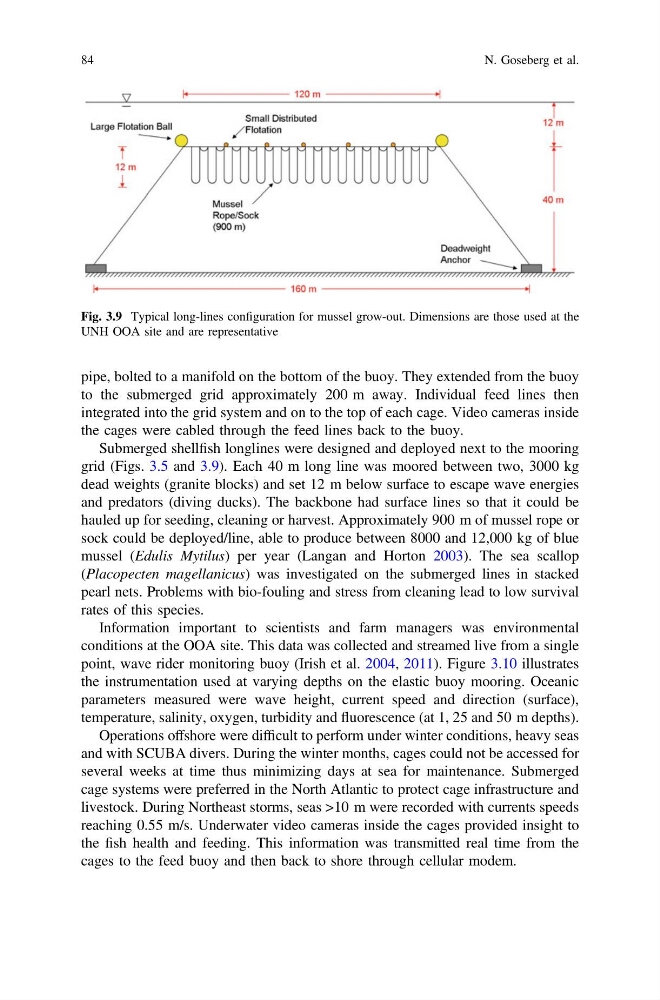
Submerged shellfish longlines were designed and deployed next to the mooring
grid (Figs. 3.5 and 3.9). Each 40 m long line was moored between two, 3000 kg
dead weights (granite blocks) and set 12 m below surface to escape wave energies
and predators (diving ducks). The backbone had surface lines so that it could be
hauled up for seeding, cleaning or harvest. Approximately 900 m of mussel rope or
sock could be deployed/line, able to produce between 8000 and 12,000 kg of blue
mussel (Edulis Mytilus) per year (Langan and Horton 2003). The sea scallop
(Placopecten magellanicus) was investigated on the submerged lines in stacked
pearl nets. Problems with bio-fouling and stress from cleaning lead to low survival
rates of this species.
Information important to scientists and farm managers was environmental
conditions at the OOA site. This data was collected and streamed live from a single
point, wave rider monitoring buoy (Irish et al. 2004, 2011). Figure 3.10 illustrates
the instrumentation used at varying depths on the elastic buoy mooring. Oceanic
parameters measured were wave height, current speed and direction (surface),
temperature, salinity, oxygen, turbidity and fluorescence (at 1, 25 and 50 m depths).
Operations offshore were difficult to perform under winter conditions, heavy seas
and with SCUBA divers. During the winter months, cages could not be accessed for
several weeks at time thus minimizing days at sea for maintenance. Submerged
cage systems were preferred in the North Atlantic to protect cage infrastructure and
livestock. During Northeast storms, seas >10 m were recorded with currents speeds
reaching 0.55 m/s. Underwater video cameras inside the cages provided insight to
the fish health and feeding. This information was transmitted real time from the
cages to the feed buoy and then back to shore through cellular modem.
Fig. 3.9 Typical long-lines configuration for mussel grow-out. Dimensions are those used at the
UNH OOA site and are representative
84
N. Goseberg et al.
to the submerged grid approximately 200 m away. Individual feed lines then
integrated into the grid system and on to the top of each cage. Video cameras inside
the cages were cabled through the feed lines back to the buoy.
Submerged shellfish longlines were designed and deployed next to the mooring
grid (Figs. 3.5 and 3.9). Each 40 m long line was moored between two, 3000 kg
dead weights (granite blocks) and set 12 m below surface to escape wave energies
and predators (diving ducks). The backbone had surface lines so that it could be
hauled up for seeding, cleaning or harvest. Approximately 900 m of mussel rope or
sock could be deployed/line, able to produce between 8000 and 12,000 kg of blue
mussel (Edulis Mytilus) per year (Langan and Horton 2003). The sea scallop
(Placopecten magellanicus) was investigated on the submerged lines in stacked
pearl nets. Problems with bio-fouling and stress from cleaning lead to low survival
rates of this species.
Information important to scientists and farm managers was environmental
conditions at the OOA site. This data was collected and streamed live from a single
point, wave rider monitoring buoy (Irish et al. 2004, 2011). Figure 3.10 illustrates
the instrumentation used at varying depths on the elastic buoy mooring. Oceanic
parameters measured were wave height, current speed and direction (surface),
temperature, salinity, oxygen, turbidity and fluorescence (at 1, 25 and 50 m depths).
Operations offshore were difficult to perform under winter conditions, heavy seas
and with SCUBA divers. During the winter months, cages could not be accessed for
several weeks at time thus minimizing days at sea for maintenance. Submerged
cage systems were preferred in the North Atlantic to protect cage infrastructure and
livestock. During Northeast storms, seas >10 m were recorded with currents speeds
reaching 0.55 m/s. Underwater video cameras inside the cages provided insight to
the fish health and feeding. This information was transmitted real time from the
cages to the feed buoy and then back to shore through cellular modem.
Fig. 3.9 Typical long-lines configuration for mussel grow-out. Dimensions are those used at the
UNH OOA site and are representative
84
N. Goseberg et al.