

206
8 Thermal Process Safety
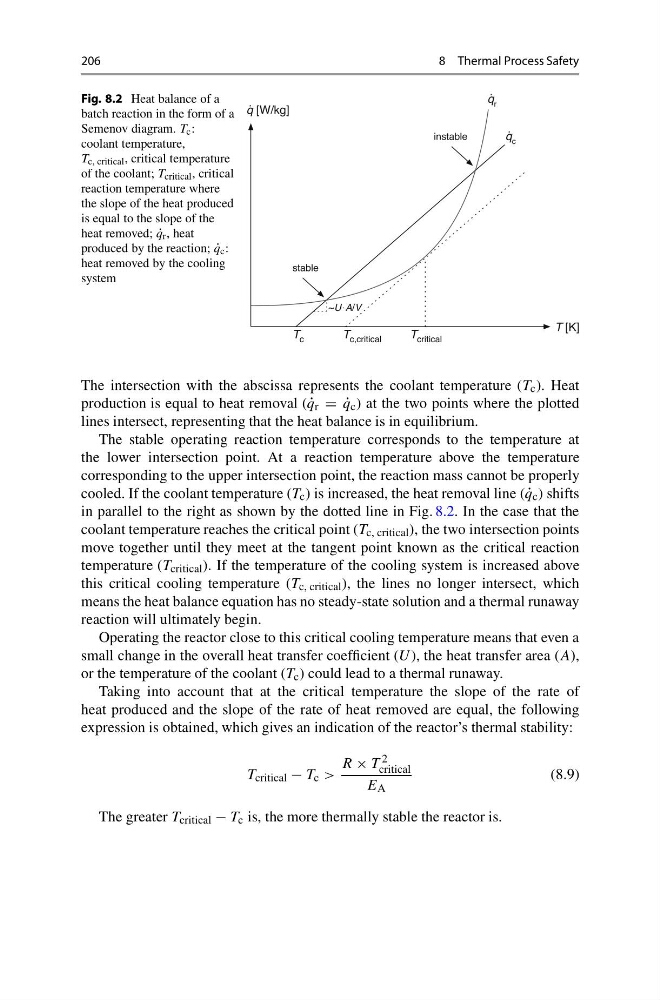
Fig. 8.2 Heat balance of a
batch reaction in the form of a
Semenov diagram. T c :
coolant temperature,
T c, critical , critical temperature
of the coolant; T critical , critical
reaction temperature where
the slope of the heat produced
is equal to the slope of the
heat removed; ˙
q r , heat
produced by the reaction; ˙
q c :
heat removed by the cooling
system
The intersection with the abscissa represents the coolant temperature (T c ). Heat
production is equal to heat removal ( ˙
q r = ˙
q c ) at the two points where the plotted
lines intersect, representing that the heat balance is in equilibrium.
The stable operating reaction temperature corresponds to the temperature at
the lower intersection point. At a reaction temperature above the temperature
corresponding to the upper intersection point, the reaction mass cannot be properly
cooled. If the coolant temperature (T c ) is increased, the heat removal line ( ˙
q c ) shifts
in parallel to the right as shown by the dotted line in Fig. 8.2. In the case that the
coolant temperature reaches the critical point (T c, critical ), the two intersection points
move together until they meet at the tangent point known as the critical reaction
temperature (T critical ). If the temperature of the cooling system is increased above
this critical cooling temperature (T c, critical ), the lines no longer intersect, which
means the heat balance equation has no steady-state solution and a thermal runaway
reaction will ultimately begin.
Operating the reactor close to this critical cooling temperature means that even a
small change in the overall heat transfer coefficient (U ), the heat transfer area (A),
or the temperature of the coolant (T c ) could lead to a thermal runaway.
Taking into account that at the critical temperature the slope of the rate of
heat produced and the slope of the rate of heat removed are equal, the following
expression is obtained, which gives an indication of the reactor’s thermal stability:
T critical − T c >
R × T 2
critical
E A
(8.9)
The greater T critical − T c is, the more thermally stable the reactor is.
8 Thermal Process Safety
Fig. 8.2 Heat balance of a
batch reaction in the form of a
Semenov diagram. T c :
coolant temperature,
T c, critical , critical temperature
of the coolant; T critical , critical
reaction temperature where
the slope of the heat produced
is equal to the slope of the
heat removed; ˙
q r , heat
produced by the reaction; ˙
q c :
heat removed by the cooling
system
The intersection with the abscissa represents the coolant temperature (T c ). Heat
production is equal to heat removal ( ˙
q r = ˙
q c ) at the two points where the plotted
lines intersect, representing that the heat balance is in equilibrium.
The stable operating reaction temperature corresponds to the temperature at
the lower intersection point. At a reaction temperature above the temperature
corresponding to the upper intersection point, the reaction mass cannot be properly
cooled. If the coolant temperature (T c ) is increased, the heat removal line ( ˙
q c ) shifts
in parallel to the right as shown by the dotted line in Fig. 8.2. In the case that the
coolant temperature reaches the critical point (T c, critical ), the two intersection points
move together until they meet at the tangent point known as the critical reaction
temperature (T critical ). If the temperature of the cooling system is increased above
this critical cooling temperature (T c, critical ), the lines no longer intersect, which
means the heat balance equation has no steady-state solution and a thermal runaway
reaction will ultimately begin.
Operating the reactor close to this critical cooling temperature means that even a
small change in the overall heat transfer coefficient (U ), the heat transfer area (A),
or the temperature of the coolant (T c ) could lead to a thermal runaway.
Taking into account that at the critical temperature the slope of the rate of
heat produced and the slope of the rate of heat removed are equal, the following
expression is obtained, which gives an indication of the reactor’s thermal stability:
T critical − T c >
R × T 2
critical
E A
(8.9)
The greater T critical − T c is, the more thermally stable the reactor is.