

R ¼ R 0 þ
V
j j
I 0
ð10:11Þ
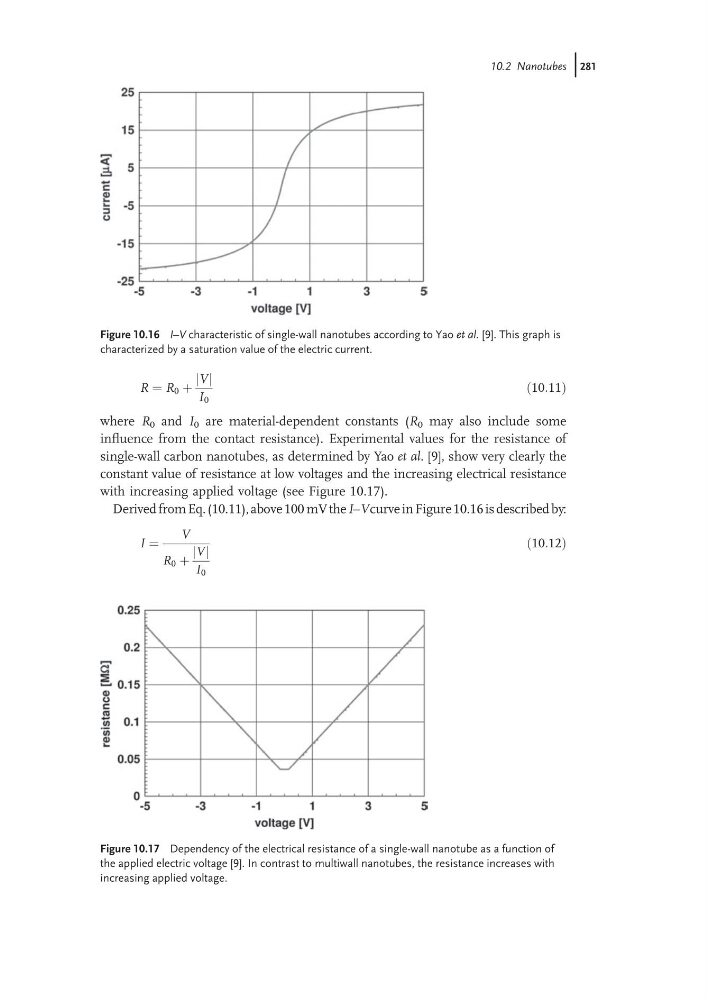
where R 0 and I 0 are material-dependent constants (R 0 may also include some
influence from the contact resistance). Experimental values for the resistance of
single-wall carbon nanotubes, as determined by Yao et al. [9], show very clearly the
constant value of resistance at low voltages and the increasing electrical resistance
with increasing applied voltage (see Figure 10.17).
Derived from Eq. (10.11), above 100 mV the I–Vcurve in Figure 10.16 is described by:
I ¼
V
R 0 þ
V
j j
I 0
ð10:12Þ
Figure 10.16 I–V characteristic of single-wall nanotubes according to Yao et al. [9]. This graph is
characterized by a saturation value of the electric current.
Figure 10.17 Dependency of the electrical resistance of a single-wall nanotube as a function of
the applied electric voltage [9]. In contrast to multiwall nanotubes, the resistance increases with
increasing applied voltage.
10.2 Nanotubes j281
V
j j
I 0
ð10:11Þ
where R 0 and I 0 are material-dependent constants (R 0 may also include some
influence from the contact resistance). Experimental values for the resistance of
single-wall carbon nanotubes, as determined by Yao et al. [9], show very clearly the
constant value of resistance at low voltages and the increasing electrical resistance
with increasing applied voltage (see Figure 10.17).
Derived from Eq. (10.11), above 100 mV the I–Vcurve in Figure 10.16 is described by:
I ¼
V
R 0 þ
V
j j
I 0
ð10:12Þ
Figure 10.16 I–V characteristic of single-wall nanotubes according to Yao et al. [9]. This graph is
characterized by a saturation value of the electric current.
Figure 10.17 Dependency of the electrical resistance of a single-wall nanotube as a function of
the applied electric voltage [9]. In contrast to multiwall nanotubes, the resistance increases with
increasing applied voltage.
10.2 Nanotubes j281