

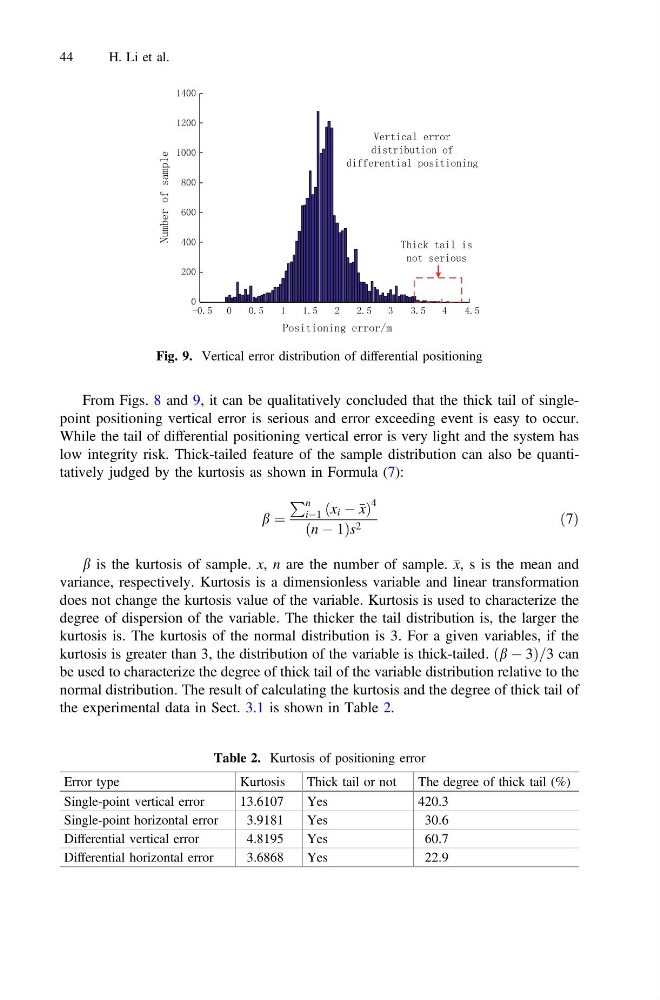
From Figs. 8 and 9, it can be qualitatively concluded that the thick tail of singlepoint positioning vertical error is serious and error exceeding event is easy to occur.
While the tail of differential positioning vertical error is very light and the system has
low integrity risk. Thick-tailed feature of the sample distribution can also be quantitatively judged by the kurtosis as shown in Formula (7):
b ¼
P n
iÀ1 x i À x
ð
Þ
4
n À 1
ð
Þs 2
ð7Þ
b is the kurtosis of sample. x, n are the number of sample. x, s is the mean and
variance, respectively. Kurtosis is a dimensionless variable and linear transformation
does not change the kurtosis value of the variable. Kurtosis is used to characterize the
degree of dispersion of the variable. The thicker the tail distribution is, the larger the
kurtosis is. The kurtosis of the normal distribution is 3. For a given variables, if the
kurtosis is greater than 3, the distribution of the variable is thick-tailed. ðb À 3Þ=3 can
be used to characterize the degree of thick tail of the variable distribution relative to the
normal distribution. The result of calculating the kurtosis and the degree of thick tail of
the experimental data in Sect. 3.1 is shown in Table 2.
Fig. 9. Vertical error distribution of differential positioning
Table 2. Kurtosis of positioning error
Error type
Kurtosis
Thick tail or not
The degree of thick tail (%)
Single-point vertical error
13.6107
Yes
420.3
Single-point horizontal error
3.9181
Yes
30.6
Differential vertical error
4.8195
Yes
60.7
Differential horizontal error
3.6868
Yes
22.9
44
H. Li et al.
While the tail of differential positioning vertical error is very light and the system has
low integrity risk. Thick-tailed feature of the sample distribution can also be quantitatively judged by the kurtosis as shown in Formula (7):
b ¼
P n
iÀ1 x i À x
ð
Þ
4
n À 1
ð
Þs 2
ð7Þ
b is the kurtosis of sample. x, n are the number of sample. x, s is the mean and
variance, respectively. Kurtosis is a dimensionless variable and linear transformation
does not change the kurtosis value of the variable. Kurtosis is used to characterize the
degree of dispersion of the variable. The thicker the tail distribution is, the larger the
kurtosis is. The kurtosis of the normal distribution is 3. For a given variables, if the
kurtosis is greater than 3, the distribution of the variable is thick-tailed. ðb À 3Þ=3 can
be used to characterize the degree of thick tail of the variable distribution relative to the
normal distribution. The result of calculating the kurtosis and the degree of thick tail of
the experimental data in Sect. 3.1 is shown in Table 2.
Fig. 9. Vertical error distribution of differential positioning
Table 2. Kurtosis of positioning error
Error type
Kurtosis
Thick tail or not
The degree of thick tail (%)
Single-point vertical error
13.6107
Yes
420.3
Single-point horizontal error
3.9181
Yes
30.6
Differential vertical error
4.8195
Yes
60.7
Differential horizontal error
3.6868
Yes
22.9
44
H. Li et al.