

The vertex pair of the digraph is in order in the graph, which represents a
directed edge from vertex u to vertex v.
If the function module is represented by node v and the relationship R existed
between the function modules is represented by the edge e connecting two points, the
line graph G = (V, E) is the digraph model corresponding to the system, where v V,
e E are all function module nodes and various connection relationships, respectively.
2.2 Diagraph Model
Diagraph model refers to the step-by-step analysis of system function structure and its
signal transmission relationship in fault diagnosis based on parts or all of the functions
of each component of the system until the specific location of the fault is determined,
which is, the representation of the function model in the digraph is established first.
Then analyze the cause of the fault and the propagation path of the fault. The functional
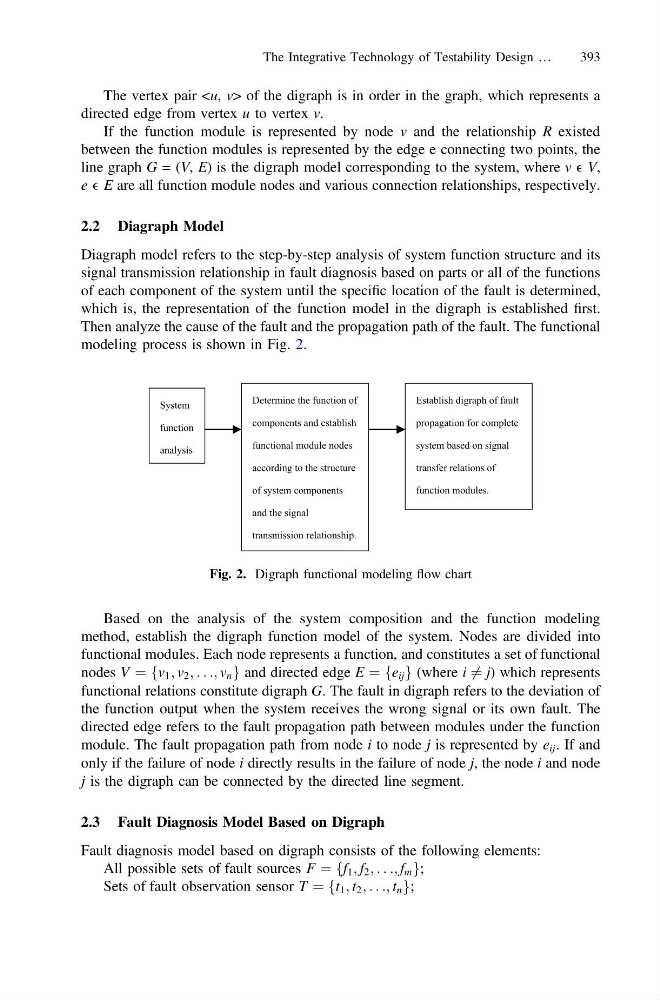
modeling process is shown in Fig. 2.
Based on the analysis of the system composition and the function modeling
method, establish the digraph function model of the system. Nodes are divided into
functional modules. Each node represents a function, and constitutes a set of functional
nodes V ¼ fv 1 ; v 2 ; . . .; v n g and directed edge E ¼ fe ij g (where i 6 ¼ j) which represents
functional relations constitute digraph G. The fault in digraph refers to the deviation of
the function output when the system receives the wrong signal or its own fault. The
directed edge refers to the fault propagation path between modules under the function
module. The fault propagation path from node i to node j is represented by e ij . If and
only if the failure of node i directly results in the failure of node j, the node i and node
j is the digraph can be connected by the directed line segment.
2.3 Fault Diagnosis Model Based on Digraph
Fault diagnosis model based on digraph consists of the following elements:
All possible sets of fault sources F ¼ f 1 ; f 2 ; . . .; f m
f
g ;
Sets of fault observation sensor T ¼ t 1 ; t 2 ; . . .; t n
f
g ;
System
function
analysis
Determine the function of
components and establish
functional module nodes
according to the structure
of system components
and the signal
transmission relationship.
Establish digraph of fault
propagation for complete
system based on signal
transfer relations of
function modules.
Fig. 2. Digraph functional modeling flow chart
The Integrative Technology of Testability Design …
393
directed edge from vertex u to vertex v.
If the function module is represented by node v and the relationship R existed
between the function modules is represented by the edge e connecting two points, the
line graph G = (V, E) is the digraph model corresponding to the system, where v V,
e E are all function module nodes and various connection relationships, respectively.
2.2 Diagraph Model
Diagraph model refers to the step-by-step analysis of system function structure and its
signal transmission relationship in fault diagnosis based on parts or all of the functions
of each component of the system until the specific location of the fault is determined,
which is, the representation of the function model in the digraph is established first.
Then analyze the cause of the fault and the propagation path of the fault. The functional
modeling process is shown in Fig. 2.
Based on the analysis of the system composition and the function modeling
method, establish the digraph function model of the system. Nodes are divided into
functional modules. Each node represents a function, and constitutes a set of functional
nodes V ¼ fv 1 ; v 2 ; . . .; v n g and directed edge E ¼ fe ij g (where i 6 ¼ j) which represents
functional relations constitute digraph G. The fault in digraph refers to the deviation of
the function output when the system receives the wrong signal or its own fault. The
directed edge refers to the fault propagation path between modules under the function
module. The fault propagation path from node i to node j is represented by e ij . If and
only if the failure of node i directly results in the failure of node j, the node i and node
j is the digraph can be connected by the directed line segment.
2.3 Fault Diagnosis Model Based on Digraph
Fault diagnosis model based on digraph consists of the following elements:
All possible sets of fault sources F ¼ f 1 ; f 2 ; . . .; f m
f
g ;
Sets of fault observation sensor T ¼ t 1 ; t 2 ; . . .; t n
f
g ;
System
function
analysis
Determine the function of
components and establish
functional module nodes
according to the structure
of system components
and the signal
transmission relationship.
Establish digraph of fault
propagation for complete
system based on signal
transfer relations of
function modules.
Fig. 2. Digraph functional modeling flow chart
The Integrative Technology of Testability Design …
393