

5 Test
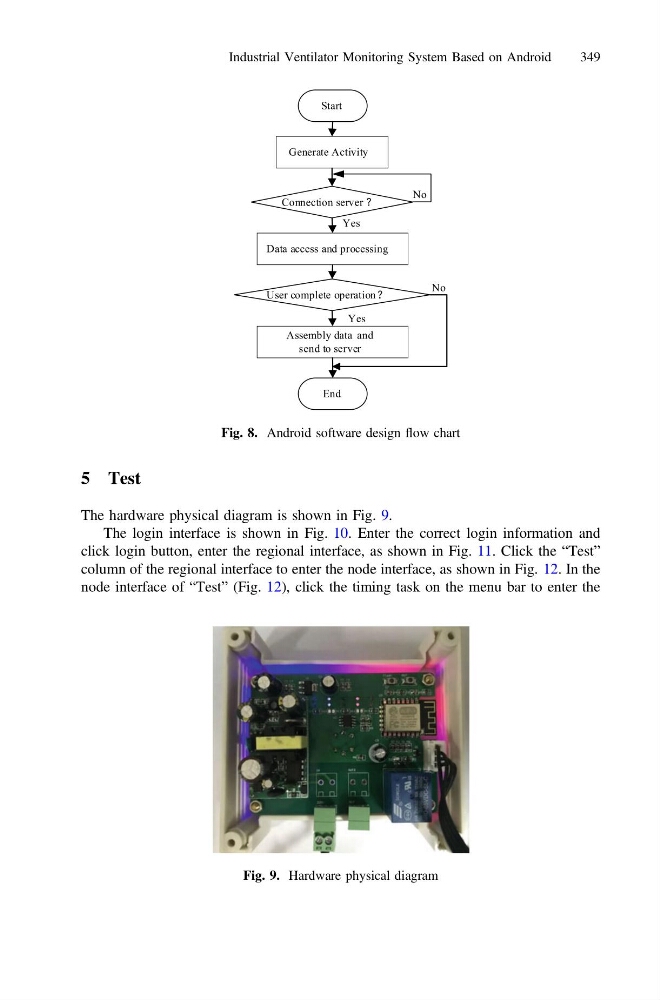
The hardware physical diagram is shown in Fig. 9.
The login interface is shown in Fig. 10. Enter the correct login information and
click login button, enter the regional interface, as shown in Fig. 11. Click the “Test”
column of the regional interface to enter the node interface, as shown in Fig. 12. In the
node interface of “Test” (Fig. 12), click the timing task on the menu bar to enter the
Connection server
Data access and processing
User complete operation
End
Assembly data and
send to server
Yes
No
No
Yes
Generate Activity
Start
Fig. 8. Android software design flow chart
Fig. 9. Hardware physical diagram
Industrial Ventilator Monitoring System Based on Android
349
The hardware physical diagram is shown in Fig. 9.
The login interface is shown in Fig. 10. Enter the correct login information and
click login button, enter the regional interface, as shown in Fig. 11. Click the “Test”
column of the regional interface to enter the node interface, as shown in Fig. 12. In the
node interface of “Test” (Fig. 12), click the timing task on the menu bar to enter the
Connection server
Data access and processing
User complete operation
End
Assembly data and
send to server
Yes
No
No
Yes
Generate Activity
Start
Fig. 8. Android software design flow chart
Fig. 9. Hardware physical diagram
Industrial Ventilator Monitoring System Based on Android
349