

Global Descriptors of Convolution Neural Networks . . .
9
Table 4. Time for training a model on dataset
Classifier
Pretain model Accuracy (%) Training time (s)
Softmax
VGGNet-16
78.3
4376
ResNet-50
82.4
2437s
Random forest (with PCA) VGGNet-16
70.8
15.73
ResNet-50
63.7
10.45
Our method
86.78
24.81
Random forest (no PCA)
VGGNet-16
72.3
54.07
ResNet-50
56.9
55.45
Fusion-feature 85.24
52.00
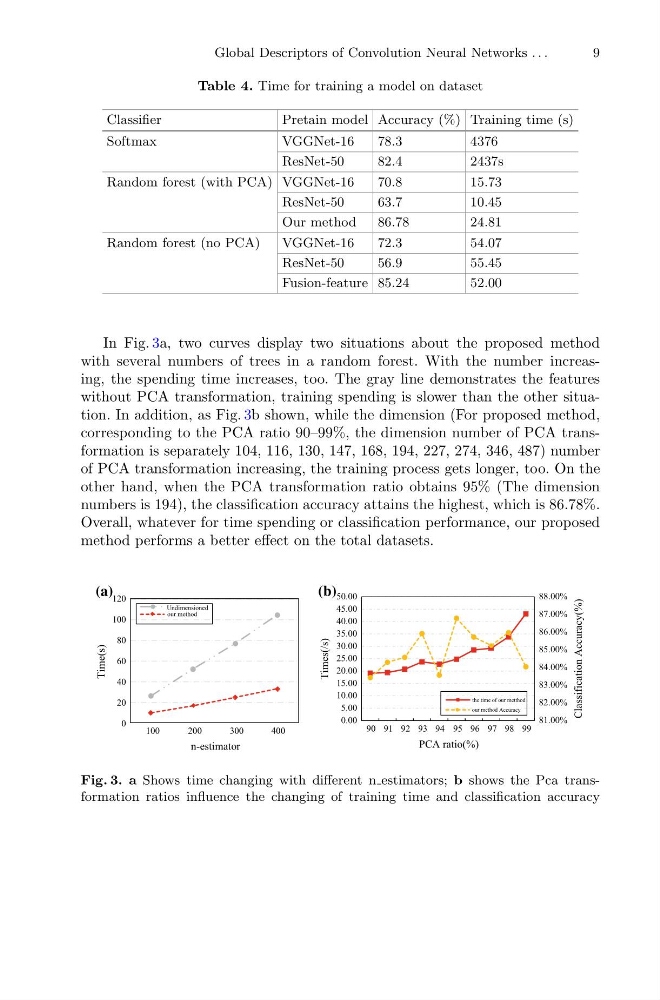
In Fig. 3a, two curves display two situations about the proposed method
with several numbers of trees in a random forest. With the number increasing, the spending time increases, too. The gray line demonstrates the features
without PCA transformation, training spending is slower than the other situation. In addition, as Fig. 3b shown, while the dimension (For proposed method,
corresponding to the PCA ratio 90–99%, the dimension number of PCA transformation is separately 104, 116, 130, 147, 168, 194, 227, 274, 346, 487) number
of PCA transformation increasing, the training process gets longer, too. On the
other hand, when the PCA transformation ratio obtains 95% (The dimension
numbers is 194), the classification accuracy attains the highest, which is 86.78%.
Overall, whatever for time spending or classification performance, our proposed
method performs a better effect on the total datasets.
0
20
40
60
80
100
120
100
200
300
400
Time(s)
n-estimator
Undimensioned
our method
81.00%
82.00%
83.00%
84.00%
85.00%
86.00%
87.00%
88.00%
0.00
5.00
10.00
15.00
20.00
25.00
30.00
35.00
40.00
45.00
50.00
90 91 92 93 94 95 96 97 98 99
Classification Accuracy(%)
Times(/s)
PCA ratio(%)
the time of our metthod
our method Accuracy
(a)
(b)
Fig. 3. a Shows time changing with different n estimators; b shows the Pca transformation ratios influence the changing of training time and classification accuracy
9
Table 4. Time for training a model on dataset
Classifier
Pretain model Accuracy (%) Training time (s)
Softmax
VGGNet-16
78.3
4376
ResNet-50
82.4
2437s
Random forest (with PCA) VGGNet-16
70.8
15.73
ResNet-50
63.7
10.45
Our method
86.78
24.81
Random forest (no PCA)
VGGNet-16
72.3
54.07
ResNet-50
56.9
55.45
Fusion-feature 85.24
52.00
In Fig. 3a, two curves display two situations about the proposed method
with several numbers of trees in a random forest. With the number increasing, the spending time increases, too. The gray line demonstrates the features
without PCA transformation, training spending is slower than the other situation. In addition, as Fig. 3b shown, while the dimension (For proposed method,
corresponding to the PCA ratio 90–99%, the dimension number of PCA transformation is separately 104, 116, 130, 147, 168, 194, 227, 274, 346, 487) number
of PCA transformation increasing, the training process gets longer, too. On the
other hand, when the PCA transformation ratio obtains 95% (The dimension
numbers is 194), the classification accuracy attains the highest, which is 86.78%.
Overall, whatever for time spending or classification performance, our proposed
method performs a better effect on the total datasets.
0
20
40
60
80
100
120
100
200
300
400
Time(s)
n-estimator
Undimensioned
our method
81.00%
82.00%
83.00%
84.00%
85.00%
86.00%
87.00%
88.00%
0.00
5.00
10.00
15.00
20.00
25.00
30.00
35.00
40.00
45.00
50.00
90 91 92 93 94 95 96 97 98 99
Classification Accuracy(%)
Times(/s)
PCA ratio(%)
the time of our metthod
our method Accuracy
(a)
(b)
Fig. 3. a Shows time changing with different n estimators; b shows the Pca transformation ratios influence the changing of training time and classification accuracy