

194
S. Hu et al.
In this paper, we choose Welch spectral estimation. The calculation method
of Welch spectral estimation is as follows. Firstly, divide the signal data of length
N into L segments, and each segment has M samples. Secondly, select the appropriate window function to weight each piece of data separately and determine the
period diagram of each segment. Finally, analysis the power spectrum for each
period diagram of each segment and compute the average of the N estimated
results.
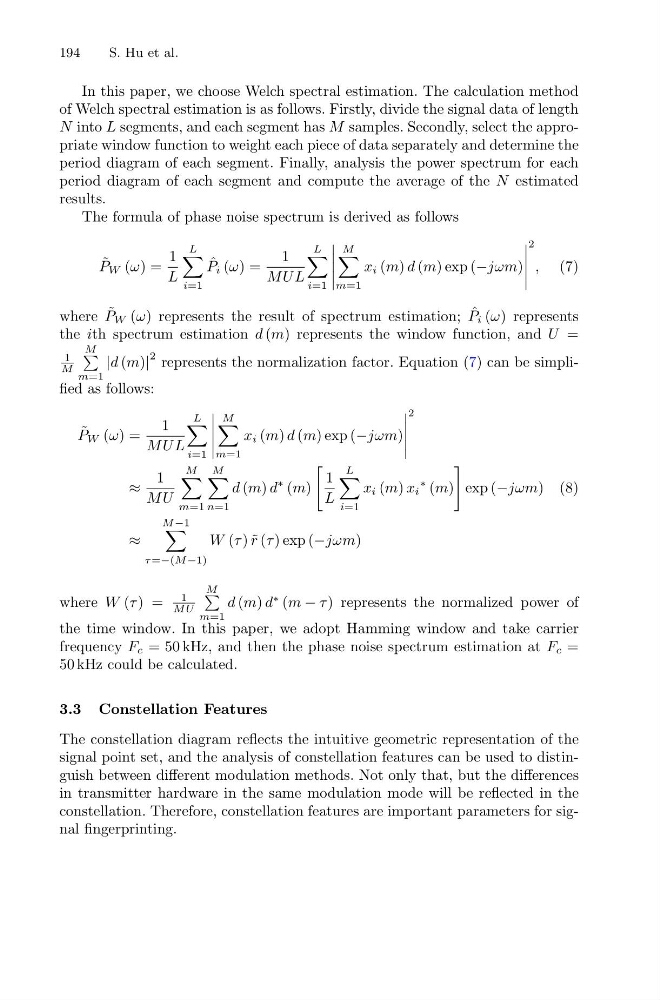
The formula of phase noise spectrum is derived as follows
˜
P W (ω) =
1
L
L
i=1
ˆ
P i (ω) =
1
MUL
L
i=1
M
m=1
x i (m) d (m) exp (−jωm)
2
, (7)
where ˜
P W (ω) represents the result of spectrum estimation; ˆ
P i (ω) represents
the ith spectrum estimation d (m) represents the window function, and U =
1
M
M
m=1
|d (m)|
2 represents the normalization factor. Equation (7) can be simplified as follows:
˜
P W (ω) =
1
MUL
L
i=1
M
m=1
x i (m) d (m) exp (−jωm)
2
≈
1
MU
M
m=1
M
n=1
d (m) d
∗ (m)
1
L
L
i=1
x i (m) x i
∗ (m)
exp (−jωm)
≈
M −1
τ =−(M −1)
W (τ ) ˜
r (τ ) exp (−jωm)
(8)
where W (τ ) =
1
MU
M
m=1
d (m) d
∗ (m − τ ) represents the normalized power of
the time window. In this paper, we adopt Hamming window and take carrier
frequency F c = 50 kHz, and then the phase noise spectrum estimation at F c =
50 kHz could be calculated.
3.3 Constellation Features
The constellation diagram reflects the intuitive geometric representation of the
signal point set, and the analysis of constellation features can be used to distinguish between different modulation methods. Not only that, but the differences
in transmitter hardware in the same modulation mode will be reflected in the
constellation. Therefore, constellation features are important parameters for signal fingerprinting.
S. Hu et al.
In this paper, we choose Welch spectral estimation. The calculation method
of Welch spectral estimation is as follows. Firstly, divide the signal data of length
N into L segments, and each segment has M samples. Secondly, select the appropriate window function to weight each piece of data separately and determine the
period diagram of each segment. Finally, analysis the power spectrum for each
period diagram of each segment and compute the average of the N estimated
results.
The formula of phase noise spectrum is derived as follows
˜
P W (ω) =
1
L
L
i=1
ˆ
P i (ω) =
1
MUL
L
i=1
M
m=1
x i (m) d (m) exp (−jωm)
2
, (7)
where ˜
P W (ω) represents the result of spectrum estimation; ˆ
P i (ω) represents
the ith spectrum estimation d (m) represents the window function, and U =
1
M
M
m=1
|d (m)|
2 represents the normalization factor. Equation (7) can be simplified as follows:
˜
P W (ω) =
1
MUL
L
i=1
M
m=1
x i (m) d (m) exp (−jωm)
2
≈
1
MU
M
m=1
M
n=1
d (m) d
∗ (m)
1
L
L
i=1
x i (m) x i
∗ (m)
exp (−jωm)
≈
M −1
τ =−(M −1)
W (τ ) ˜
r (τ ) exp (−jωm)
(8)
where W (τ ) =
1
MU
M
m=1
d (m) d
∗ (m − τ ) represents the normalized power of
the time window. In this paper, we adopt Hamming window and take carrier
frequency F c = 50 kHz, and then the phase noise spectrum estimation at F c =
50 kHz could be calculated.
3.3 Constellation Features
The constellation diagram reflects the intuitive geometric representation of the
signal point set, and the analysis of constellation features can be used to distinguish between different modulation methods. Not only that, but the differences
in transmitter hardware in the same modulation mode will be reflected in the
constellation. Therefore, constellation features are important parameters for signal fingerprinting.