

the two regions are combined. The value of IoU is between 0 and 1. The larger the
value, the better the prediction effect and the better the work for subsequent character
recognition.
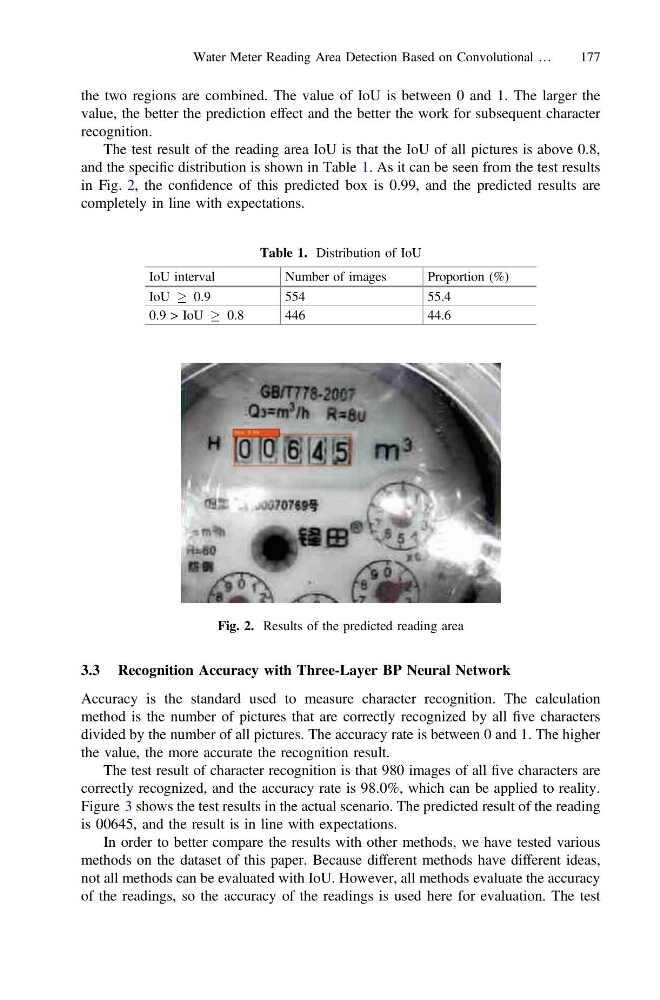
The test result of the reading area IoU is that the IoU of all pictures is above 0.8,
and the specific distribution is shown in Table 1. As it can be seen from the test results
in Fig. 2, the confidence of this predicted box is 0.99, and the predicted results are
completely in line with expectations.
3.3 Recognition Accuracy with Three-Layer BP Neural Network
Accuracy is the standard used to measure character recognition. The calculation
method is the number of pictures that are correctly recognized by all five characters
divided by the number of all pictures. The accuracy rate is between 0 and 1. The higher
the value, the more accurate the recognition result.
The test result of character recognition is that 980 images of all five characters are
correctly recognized, and the accuracy rate is 98.0%, which can be applied to reality.
Figure 3 shows the test results in the actual scenario. The predicted result of the reading
is 00645, and the result is in line with expectations.
In order to better compare the results with other methods, we have tested various
methods on the dataset of this paper. Because different methods have different ideas,
not all methods can be evaluated with IoU. However, all methods evaluate the accuracy
of the readings, so the accuracy of the readings is used here for evaluation. The test
Table 1. Distribution of IoU
IoU interval
Number of images
Proportion (%)
IoU ! 0.9
554
55.4
0.9 > IoU ! 0.8
446
44.6
Fig. 2. Results of the predicted reading area
Water Meter Reading Area Detection Based on Convolutional …
177
value, the better the prediction effect and the better the work for subsequent character
recognition.
The test result of the reading area IoU is that the IoU of all pictures is above 0.8,
and the specific distribution is shown in Table 1. As it can be seen from the test results
in Fig. 2, the confidence of this predicted box is 0.99, and the predicted results are
completely in line with expectations.
3.3 Recognition Accuracy with Three-Layer BP Neural Network
Accuracy is the standard used to measure character recognition. The calculation
method is the number of pictures that are correctly recognized by all five characters
divided by the number of all pictures. The accuracy rate is between 0 and 1. The higher
the value, the more accurate the recognition result.
The test result of character recognition is that 980 images of all five characters are
correctly recognized, and the accuracy rate is 98.0%, which can be applied to reality.
Figure 3 shows the test results in the actual scenario. The predicted result of the reading
is 00645, and the result is in line with expectations.
In order to better compare the results with other methods, we have tested various
methods on the dataset of this paper. Because different methods have different ideas,
not all methods can be evaluated with IoU. However, all methods evaluate the accuracy
of the readings, so the accuracy of the readings is used here for evaluation. The test
Table 1. Distribution of IoU
IoU interval
Number of images
Proportion (%)
IoU ! 0.9
554
55.4
0.9 > IoU ! 0.8
446
44.6
Fig. 2. Results of the predicted reading area
Water Meter Reading Area Detection Based on Convolutional …
177