

4.3 Comparative Analysis
4.3.1 Effect of Rumor Detection Threshold on Experimental Results
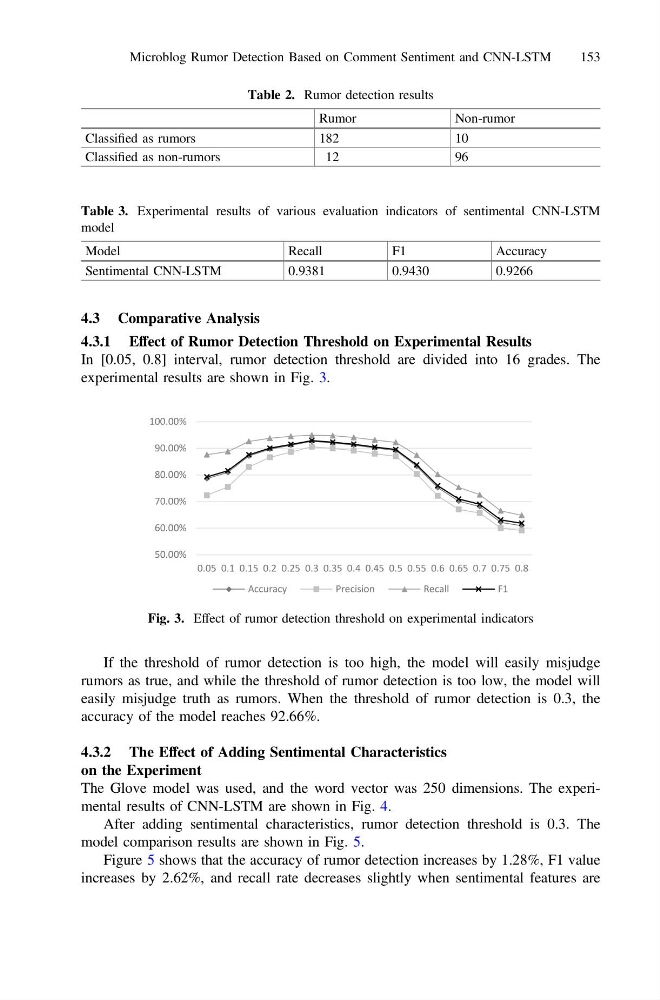
In [0.05, 0.8] interval, rumor detection threshold are divided into 16 grades. The
experimental results are shown in Fig. 3.
If the threshold of rumor detection is too high, the model will easily misjudge
rumors as true, and while the threshold of rumor detection is too low, the model will
easily misjudge truth as rumors. When the threshold of rumor detection is 0.3, the
accuracy of the model reaches 92.66%.
4.3.2 The Effect of Adding Sentimental Characteristics
on the Experiment
The Glove model was used, and the word vector was 250 dimensions. The experimental results of CNN-LSTM are shown in Fig. 4.
After adding sentimental characteristics, rumor detection threshold is 0.3. The
model comparison results are shown in Fig. 5.
Figure 5 shows that the accuracy of rumor detection increases by 1.28%, F1 value
increases by 2.62%, and recall rate decreases slightly when sentimental features are
Table 3. Experimental results of various evaluation indicators of sentimental CNN-LSTM
model
Model
Recall
F1
Accuracy
Sentimental CNN-LSTM
0.9381
0.9430
0.9266
50.00%
60.00%
70.00%
80.00%
90.00%
100.00%
0.05 0.1 0.15 0.2 0.25 0.3 0.35 0.4 0.45 0.5 0.55 0.6 0.65 0.7 0.75 0.8
Accuracy
Precision
Recall
F1
Fig. 3. Effect of rumor detection threshold on experimental indicators
Table 2. Rumor detection results
Rumor
Non-rumor
Classified as rumors
182
10
Classified as non-rumors
12
96
Microblog Rumor Detection Based on Comment Sentiment and CNN-LSTM
153
4.3.1 Effect of Rumor Detection Threshold on Experimental Results
In [0.05, 0.8] interval, rumor detection threshold are divided into 16 grades. The
experimental results are shown in Fig. 3.
If the threshold of rumor detection is too high, the model will easily misjudge
rumors as true, and while the threshold of rumor detection is too low, the model will
easily misjudge truth as rumors. When the threshold of rumor detection is 0.3, the
accuracy of the model reaches 92.66%.
4.3.2 The Effect of Adding Sentimental Characteristics
on the Experiment
The Glove model was used, and the word vector was 250 dimensions. The experimental results of CNN-LSTM are shown in Fig. 4.
After adding sentimental characteristics, rumor detection threshold is 0.3. The
model comparison results are shown in Fig. 5.
Figure 5 shows that the accuracy of rumor detection increases by 1.28%, F1 value
increases by 2.62%, and recall rate decreases slightly when sentimental features are
Table 3. Experimental results of various evaluation indicators of sentimental CNN-LSTM
model
Model
Recall
F1
Accuracy
Sentimental CNN-LSTM
0.9381
0.9430
0.9266
50.00%
60.00%
70.00%
80.00%
90.00%
100.00%
0.05 0.1 0.15 0.2 0.25 0.3 0.35 0.4 0.45 0.5 0.55 0.6 0.65 0.7 0.75 0.8
Accuracy
Precision
Recall
F1
Fig. 3. Effect of rumor detection threshold on experimental indicators
Table 2. Rumor detection results
Rumor
Non-rumor
Classified as rumors
182
10
Classified as non-rumors
12
96
Microblog Rumor Detection Based on Comment Sentiment and CNN-LSTM
153