

176
11 Statistics of Counting
B-blue
A-gray
Range (deviation from mean in term of standard deviation)
Frequency of occurance
C-ash
Mean
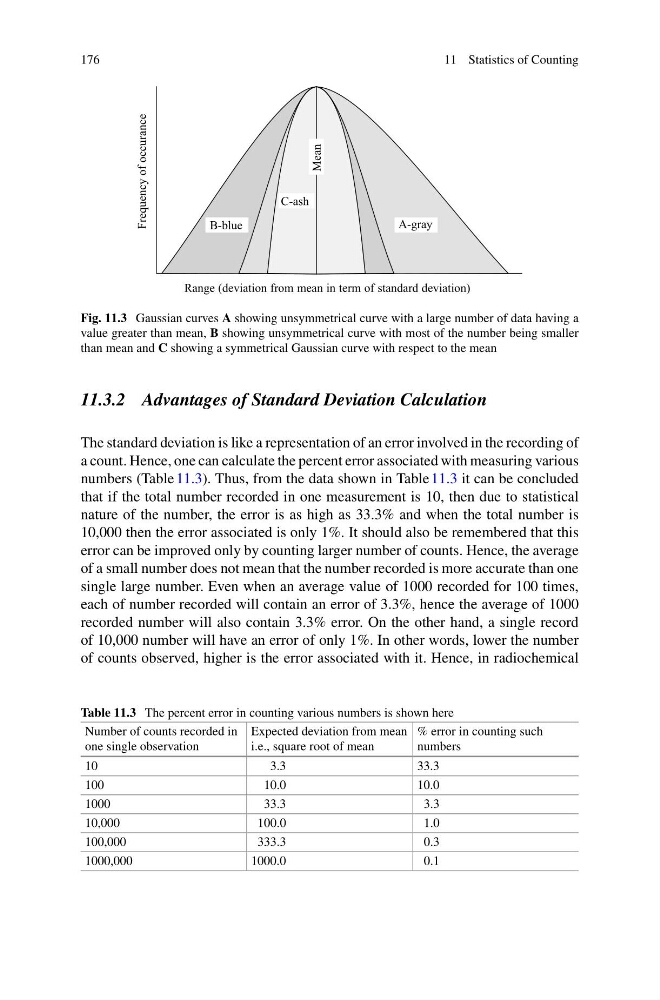
Fig. 11.3 Gaussian curves A showing unsymmetrical curve with a large number of data having a
value greater than mean, B showing unsymmetrical curve with most of the number being smaller
than mean and C showing a symmetrical Gaussian curve with respect to the mean
11.3.2 Advantages of Standard Deviation Calculation
The standard deviation is like a representation of an error involved in the recording of
a count. Hence, one can calculate the percent error associated with measuring various
numbers (Table 11.3). Thus, from the data shown in Table 11.3 it can be concluded
that if the total number recorded in one measurement is 10, then due to statistical
nature of the number, the error is as high as 33.3% and when the total number is
10,000 then the error associated is only 1%. It should also be remembered that this
error can be improved only by counting larger number of counts. Hence, the average
of a small number does not mean that the number recorded is more accurate than one
single large number. Even when an average value of 1000 recorded for 100 times,
each of number recorded will contain an error of 3.3%, hence the average of 1000
recorded number will also contain 3.3% error. On the other hand, a single record
of 10,000 number will have an error of only 1%. In other words, lower the number
of counts observed, higher is the error associated with it. Hence, in radiochemical
Table 11.3 The percent error in counting various numbers is shown here
Number of counts recorded in
one single observation
Expected deviation from mean
i.e., square root of mean
% error in counting such
numbers
10
3.3
33.3
100
10.0
10.0
1000
33.3
3.3
10,000
100.0
1.0
100,000
333.3
0.3
1000,000
1000.0
0.1
11 Statistics of Counting
B-blue
A-gray
Range (deviation from mean in term of standard deviation)
Frequency of occurance
C-ash
Mean
Fig. 11.3 Gaussian curves A showing unsymmetrical curve with a large number of data having a
value greater than mean, B showing unsymmetrical curve with most of the number being smaller
than mean and C showing a symmetrical Gaussian curve with respect to the mean
11.3.2 Advantages of Standard Deviation Calculation
The standard deviation is like a representation of an error involved in the recording of
a count. Hence, one can calculate the percent error associated with measuring various
numbers (Table 11.3). Thus, from the data shown in Table 11.3 it can be concluded
that if the total number recorded in one measurement is 10, then due to statistical
nature of the number, the error is as high as 33.3% and when the total number is
10,000 then the error associated is only 1%. It should also be remembered that this
error can be improved only by counting larger number of counts. Hence, the average
of a small number does not mean that the number recorded is more accurate than one
single large number. Even when an average value of 1000 recorded for 100 times,
each of number recorded will contain an error of 3.3%, hence the average of 1000
recorded number will also contain 3.3% error. On the other hand, a single record
of 10,000 number will have an error of only 1%. In other words, lower the number
of counts observed, higher is the error associated with it. Hence, in radiochemical
Table 11.3 The percent error in counting various numbers is shown here
Number of counts recorded in
one single observation
Expected deviation from mean
i.e., square root of mean
% error in counting such
numbers
10
3.3
33.3
100
10.0
10.0
1000
33.3
3.3
10,000
100.0
1.0
100,000
333.3
0.3
1000,000
1000.0
0.1