

110
6 Scintillation Counter
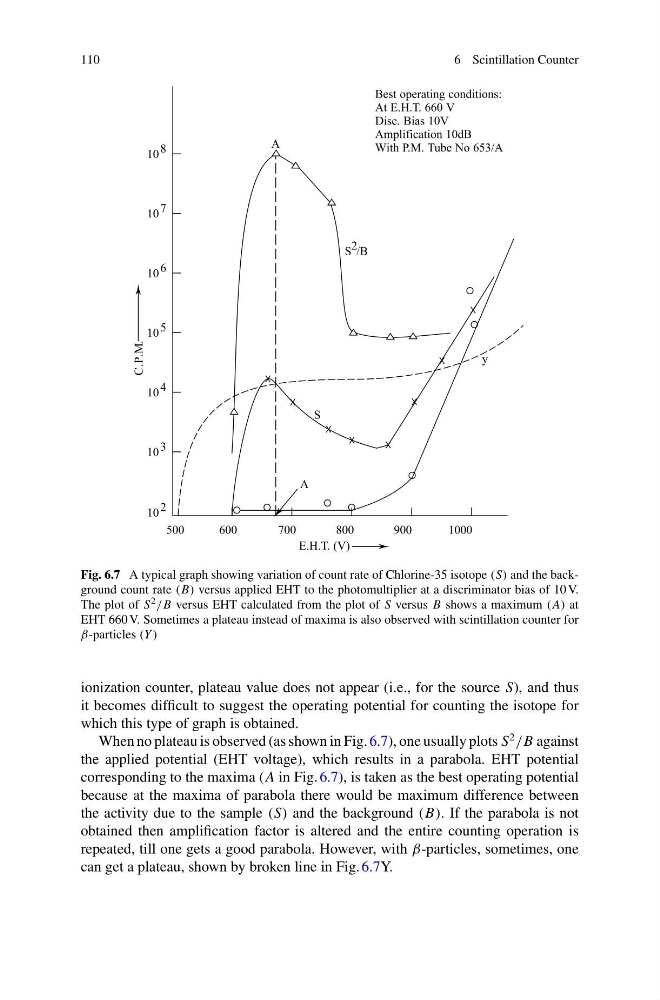
Fig. 6.7 A typical graph showing variation of count rate of Chlorine-35 isotope (S) and the background count rate (B) versus applied EHT to the photomultiplier at a discriminator bias of 10 V.
The plot of S 2 /B versus EHT calculated from the plot of S versus B shows a maximum (A) at
EHT 660 V. Sometimes a plateau instead of maxima is also observed with scintillation counter for
β-particles (Y )
ionization counter, plateau value does not appear (i.e., for the source S), and thus
it becomes difficult to suggest the operating potential for counting the isotope for
which this type of graph is obtained.
When no plateau is observed (as shown in Fig. 6.7), one usually plots S
2
/B against
the applied potential (EHT voltage), which results in a parabola. EHT potential
corresponding to the maxima (A in Fig. 6.7), is taken as the best operating potential
because at the maxima of parabola there would be maximum difference between
the activity due to the sample (S) and the background (B). If the parabola is not
obtained then amplification factor is altered and the entire counting operation is
repeated, till one gets a good parabola. However, with β-particles, sometimes, one
can get a plateau, shown by broken line in Fig. 6.7Y.
6 Scintillation Counter
Fig. 6.7 A typical graph showing variation of count rate of Chlorine-35 isotope (S) and the background count rate (B) versus applied EHT to the photomultiplier at a discriminator bias of 10 V.
The plot of S 2 /B versus EHT calculated from the plot of S versus B shows a maximum (A) at
EHT 660 V. Sometimes a plateau instead of maxima is also observed with scintillation counter for
β-particles (Y )
ionization counter, plateau value does not appear (i.e., for the source S), and thus
it becomes difficult to suggest the operating potential for counting the isotope for
which this type of graph is obtained.
When no plateau is observed (as shown in Fig. 6.7), one usually plots S
2
/B against
the applied potential (EHT voltage), which results in a parabola. EHT potential
corresponding to the maxima (A in Fig. 6.7), is taken as the best operating potential
because at the maxima of parabola there would be maximum difference between
the activity due to the sample (S) and the background (B). If the parabola is not
obtained then amplification factor is altered and the entire counting operation is
repeated, till one gets a good parabola. However, with β-particles, sometimes, one
can get a plateau, shown by broken line in Fig. 6.7Y.