

5.2 Interphase Characterisation of PVA-Based Bionanocomposites
119
5.2.2 Modulus-Gradient Effect
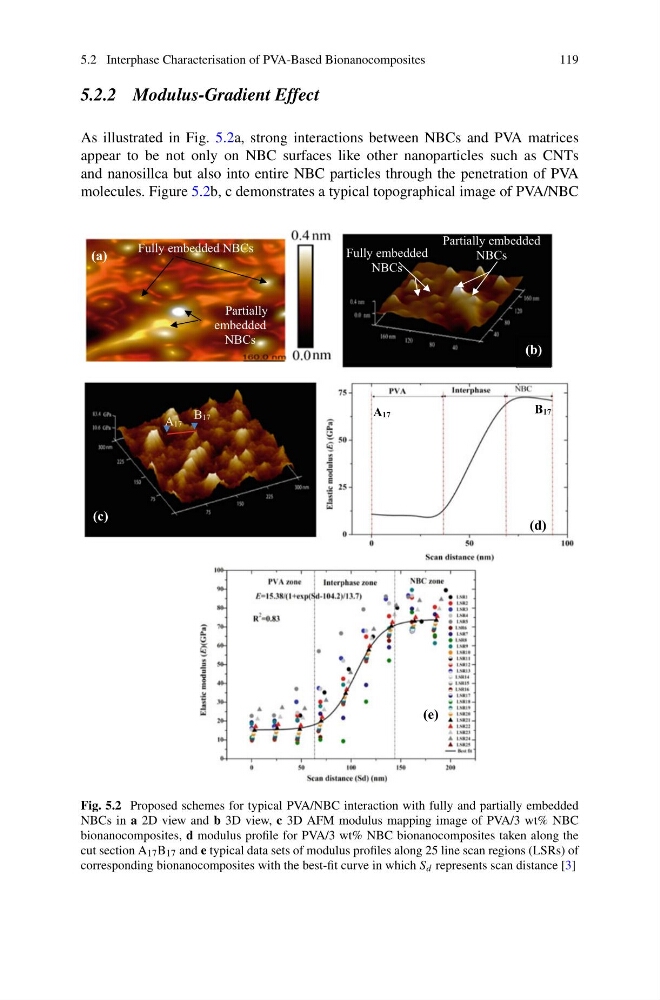
As illustrated in Fig. 5.2a, strong interactions between NBCs and PVA matrices
appear to be not only on NBC surfaces like other nanoparticles such as CNTs
and nanosillca but also into entire NBC particles through the penetration of PVA
molecules. Figure 5.2b, c demonstrates a typical topographical image of PVA/NBC
Fully embedded NBCs
Partially
embedded
NBCs
Fully embedded
NBCs
Partially embedded
NBCs
(a)
A17
B17
(d)
(e)
(c)
A17
B17
(b)
Fig. 5.2 Proposed schemes for typical PVA/NBC interaction with fully and partially embedded
NBCs in a 2D view and b 3D view, c 3D AFM modulus mapping image of PVA/3 wt% NBC
bionanocomposites, d modulus profile for PVA/3 wt% NBC bionanocomposites taken along the
cut section A 17 B 17 and e typical data sets of modulus profiles along 25 line scan regions (LSRs) of
corresponding bionanocomposites with the best-fit curve in which S d represents scan distance [3]
119
5.2.2 Modulus-Gradient Effect
As illustrated in Fig. 5.2a, strong interactions between NBCs and PVA matrices
appear to be not only on NBC surfaces like other nanoparticles such as CNTs
and nanosillca but also into entire NBC particles through the penetration of PVA
molecules. Figure 5.2b, c demonstrates a typical topographical image of PVA/NBC
Fully embedded NBCs
Partially
embedded
NBCs
Fully embedded
NBCs
Partially embedded
NBCs
(a)
A17
B17
(d)
(e)
(c)
A17
B17
(b)
Fig. 5.2 Proposed schemes for typical PVA/NBC interaction with fully and partially embedded
NBCs in a 2D view and b 3D view, c 3D AFM modulus mapping image of PVA/3 wt% NBC
bionanocomposites, d modulus profile for PVA/3 wt% NBC bionanocomposites taken along the
cut section A 17 B 17 and e typical data sets of modulus profiles along 25 line scan regions (LSRs) of
corresponding bionanocomposites with the best-fit curve in which S d represents scan distance [3]