

304
M. Méndez and T. M. Belloni
10
100
Q
l
max
0.01
0.1
1
1
10
2
5
r
l
max (%)
L/L Edd
(a)
10
20
50
Q u
max
0.01
0.1
1
10
2
5
20
r u
max (%)
L/L Edd
(b)
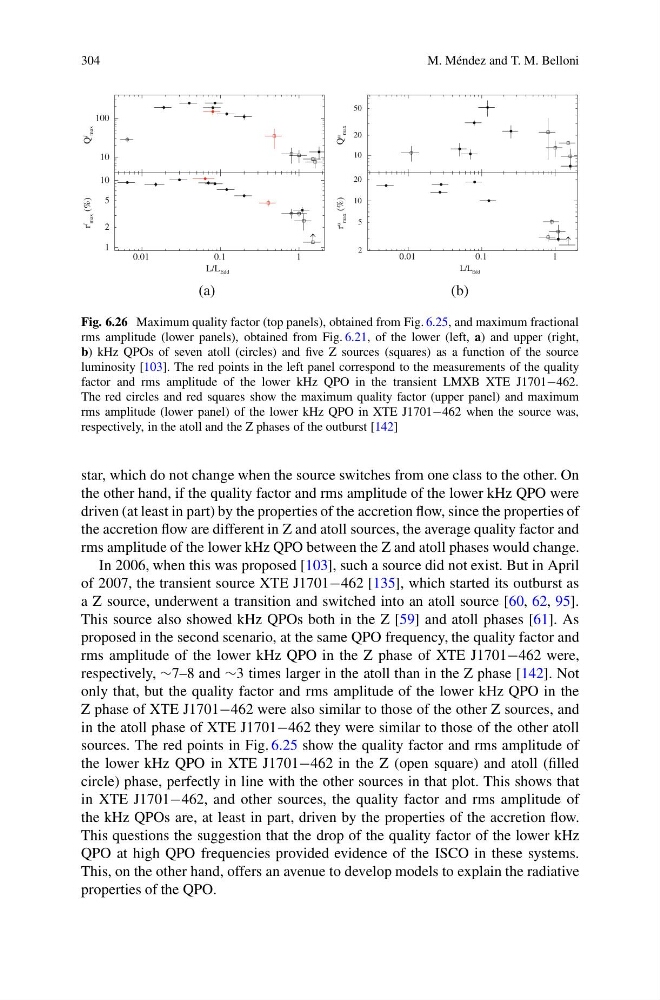
Fig. 6.26 Maximum quality factor (top panels), obtained from Fig. 6.25, and maximum fractional
rms amplitude (lower panels), obtained from Fig. 6.21, of the lower (left, a) and upper (right,
b) kHz QPOs of seven atoll (circles) and five Z sources (squares) as a function of the source
luminosity [103]. The red points in the left panel correspond to the measurements of the quality
factor and rms amplitude of the lower kHz QPO in the transient LMXB XTE J1701−462.
The red circles and red squares show the maximum quality factor (upper panel) and maximum
rms amplitude (lower panel) of the lower kHz QPO in XTE J1701−462 when the source was,
respectively, in the atoll and the Z phases of the outburst [142]
star, which do not change when the source switches from one class to the other. On
the other hand, if the quality factor and rms amplitude of the lower kHz QPO were
driven (at least in part) by the properties of the accretion flow, since the properties of
the accretion flow are different in Z and atoll sources, the average quality factor and
rms amplitude of the lower kHz QPO between the Z and atoll phases would change.
In 2006, when this was proposed [103], such a source did not exist. But in April
of 2007, the transient source XTE J1701−462 [135], which started its outburst as
a Z source, underwent a transition and switched into an atoll source [60, 62, 95].
This source also showed kHz QPOs both in the Z [59] and atoll phases [61]. As
proposed in the second scenario, at the same QPO frequency, the quality factor and
rms amplitude of the lower kHz QPO in the Z phase of XTE J1701−462 were,
respectively, ∼7–8 and ∼3 times larger in the atoll than in the Z phase [142]. Not
only that, but the quality factor and rms amplitude of the lower kHz QPO in the
Z phase of XTE J1701−462 were also similar to those of the other Z sources, and
in the atoll phase of XTE J1701−462 they were similar to those of the other atoll
sources. The red points in Fig. 6.25 show the quality factor and rms amplitude of
the lower kHz QPO in XTE J1701−462 in the Z (open square) and atoll (filled
circle) phase, perfectly in line with the other sources in that plot. This shows that
in XTE J1701−462, and other sources, the quality factor and rms amplitude of
the kHz QPOs are, at least in part, driven by the properties of the accretion flow.
This questions the suggestion that the drop of the quality factor of the lower kHz
QPO at high QPO frequencies provided evidence of the ISCO in these systems.
This, on the other hand, offers an avenue to develop models to explain the radiative
properties of the QPO.
M. Méndez and T. M. Belloni
10
100
Q
l
max
0.01
0.1
1
1
10
2
5
r
l
max (%)
L/L Edd
(a)
10
20
50
Q u
max
0.01
0.1
1
10
2
5
20
r u
max (%)
L/L Edd
(b)
Fig. 6.26 Maximum quality factor (top panels), obtained from Fig. 6.25, and maximum fractional
rms amplitude (lower panels), obtained from Fig. 6.21, of the lower (left, a) and upper (right,
b) kHz QPOs of seven atoll (circles) and five Z sources (squares) as a function of the source
luminosity [103]. The red points in the left panel correspond to the measurements of the quality
factor and rms amplitude of the lower kHz QPO in the transient LMXB XTE J1701−462.
The red circles and red squares show the maximum quality factor (upper panel) and maximum
rms amplitude (lower panel) of the lower kHz QPO in XTE J1701−462 when the source was,
respectively, in the atoll and the Z phases of the outburst [142]
star, which do not change when the source switches from one class to the other. On
the other hand, if the quality factor and rms amplitude of the lower kHz QPO were
driven (at least in part) by the properties of the accretion flow, since the properties of
the accretion flow are different in Z and atoll sources, the average quality factor and
rms amplitude of the lower kHz QPO between the Z and atoll phases would change.
In 2006, when this was proposed [103], such a source did not exist. But in April
of 2007, the transient source XTE J1701−462 [135], which started its outburst as
a Z source, underwent a transition and switched into an atoll source [60, 62, 95].
This source also showed kHz QPOs both in the Z [59] and atoll phases [61]. As
proposed in the second scenario, at the same QPO frequency, the quality factor and
rms amplitude of the lower kHz QPO in the Z phase of XTE J1701−462 were,
respectively, ∼7–8 and ∼3 times larger in the atoll than in the Z phase [142]. Not
only that, but the quality factor and rms amplitude of the lower kHz QPO in the
Z phase of XTE J1701−462 were also similar to those of the other Z sources, and
in the atoll phase of XTE J1701−462 they were similar to those of the other atoll
sources. The red points in Fig. 6.25 show the quality factor and rms amplitude of
the lower kHz QPO in XTE J1701−462 in the Z (open square) and atoll (filled
circle) phase, perfectly in line with the other sources in that plot. This shows that
in XTE J1701−462, and other sources, the quality factor and rms amplitude of
the kHz QPOs are, at least in part, driven by the properties of the accretion flow.
This questions the suggestion that the drop of the quality factor of the lower kHz
QPO at high QPO frequencies provided evidence of the ISCO in these systems.
This, on the other hand, offers an avenue to develop models to explain the radiative
properties of the QPO.