

6 High-Frequency Variability in Neutron-Star Low-Mass X-ray Binaries
271
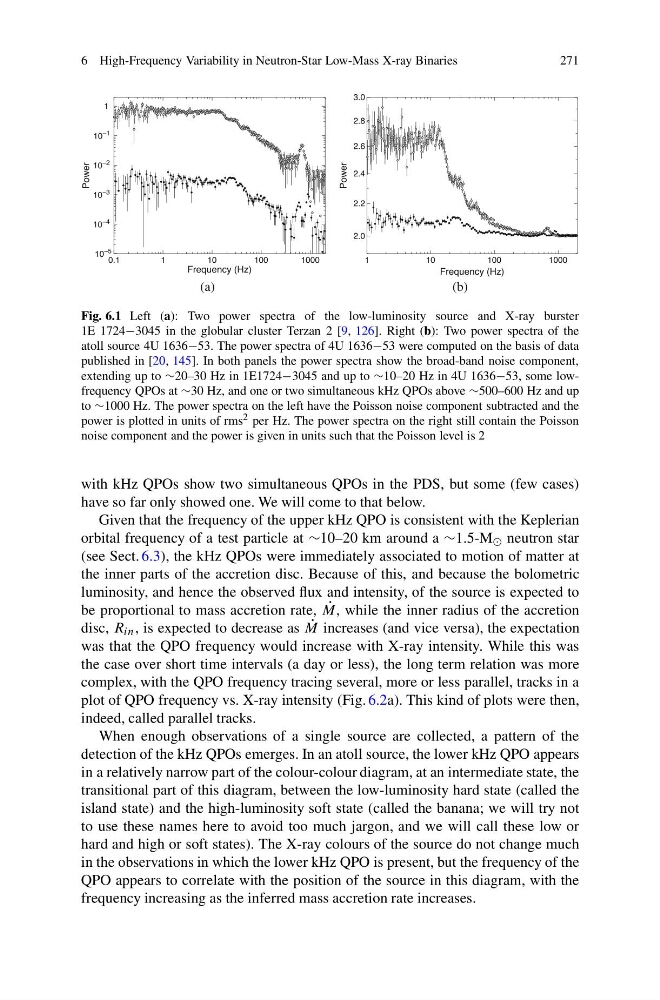
Fig. 6.1 Left (a): Two power spectra of the low-luminosity source and X-ray burster
1E 1724−3045 in the globular cluster Terzan 2 [9, 126]. Right (b): Two power spectra of the
atoll source 4U 1636−53. The power spectra of 4U 1636−53 were computed on the basis of data
published in [20, 145]. In both panels the power spectra show the broad-band noise component,
extending up to ∼20–30 Hz in 1E1724−3045 and up to ∼10–20 Hz in 4U 1636−53, some lowfrequency QPOs at ∼30 Hz, and one or two simultaneous kHz QPOs above ∼500–600 Hz and up
to ∼1000 Hz. The power spectra on the left have the Poisson noise component subtracted and the
power is plotted in units of rms 2 per Hz. The power spectra on the right still contain the Poisson
noise component and the power is given in units such that the Poisson level is 2
with kHz QPOs show two simultaneous QPOs in the PDS, but some (few cases)
have so far only showed one. We will come to that below.
Given that the frequency of the upper kHz QPO is consistent with the Keplerian
orbital frequency of a test particle at ∼10–20 km around a ∼1.5-M neutron star
(see Sect. 6.3), the kHz QPOs were immediately associated to motion of matter at
the inner parts of the accretion disc. Because of this, and because the bolometric
luminosity, and hence the observed flux and intensity, of the source is expected to
be proportional to mass accretion rate, ˙
M, while the inner radius of the accretion
disc, R in , is expected to decrease as ˙
M increases (and vice versa), the expectation
was that the QPO frequency would increase with X-ray intensity. While this was
the case over short time intervals (a day or less), the long term relation was more
complex, with the QPO frequency tracing several, more or less parallel, tracks in a
plot of QPO frequency vs. X-ray intensity (Fig. 6.2a). This kind of plots were then,
indeed, called parallel tracks.
When enough observations of a single source are collected, a pattern of the
detection of the kHz QPOs emerges. In an atoll source, the lower kHz QPO appears
in a relatively narrow part of the colour-colour diagram, at an intermediate state, the
transitional part of this diagram, between the low-luminosity hard state (called the
island state) and the high-luminosity soft state (called the banana; we will try not
to use these names here to avoid too much jargon, and we will call these low or
hard and high or soft states). The X-ray colours of the source do not change much
in the observations in which the lower kHz QPO is present, but the frequency of the
QPO appears to correlate with the position of the source in this diagram, with the
frequency increasing as the inferred mass accretion rate increases.
271
Fig. 6.1 Left (a): Two power spectra of the low-luminosity source and X-ray burster
1E 1724−3045 in the globular cluster Terzan 2 [9, 126]. Right (b): Two power spectra of the
atoll source 4U 1636−53. The power spectra of 4U 1636−53 were computed on the basis of data
published in [20, 145]. In both panels the power spectra show the broad-band noise component,
extending up to ∼20–30 Hz in 1E1724−3045 and up to ∼10–20 Hz in 4U 1636−53, some lowfrequency QPOs at ∼30 Hz, and one or two simultaneous kHz QPOs above ∼500–600 Hz and up
to ∼1000 Hz. The power spectra on the left have the Poisson noise component subtracted and the
power is plotted in units of rms 2 per Hz. The power spectra on the right still contain the Poisson
noise component and the power is given in units such that the Poisson level is 2
with kHz QPOs show two simultaneous QPOs in the PDS, but some (few cases)
have so far only showed one. We will come to that below.
Given that the frequency of the upper kHz QPO is consistent with the Keplerian
orbital frequency of a test particle at ∼10–20 km around a ∼1.5-M neutron star
(see Sect. 6.3), the kHz QPOs were immediately associated to motion of matter at
the inner parts of the accretion disc. Because of this, and because the bolometric
luminosity, and hence the observed flux and intensity, of the source is expected to
be proportional to mass accretion rate, ˙
M, while the inner radius of the accretion
disc, R in , is expected to decrease as ˙
M increases (and vice versa), the expectation
was that the QPO frequency would increase with X-ray intensity. While this was
the case over short time intervals (a day or less), the long term relation was more
complex, with the QPO frequency tracing several, more or less parallel, tracks in a
plot of QPO frequency vs. X-ray intensity (Fig. 6.2a). This kind of plots were then,
indeed, called parallel tracks.
When enough observations of a single source are collected, a pattern of the
detection of the kHz QPOs emerges. In an atoll source, the lower kHz QPO appears
in a relatively narrow part of the colour-colour diagram, at an intermediate state, the
transitional part of this diagram, between the low-luminosity hard state (called the
island state) and the high-luminosity soft state (called the banana; we will try not
to use these names here to avoid too much jargon, and we will call these low or
hard and high or soft states). The X-ray colours of the source do not change much
in the observations in which the lower kHz QPO is present, but the frequency of the
QPO appears to correlate with the position of the source in this diagram, with the
frequency increasing as the inferred mass accretion rate increases.