

246
D. K. Galloway and L. Keek
Most simulations use an implicit hydrodynamics scheme, which assumes hydrostatic equilibrium and uses mixing length theory to approximate convection and
other turbulent mixing processes. This allows for the model to be evolved over long
times, simulating multiple complete bursts. The past decade saw the introduction
of full nuclear reaction networks covering up to ≈1300 isotopes [44, 90, 201]
(Fig. 5.14). These models are being used to study a wide range of bursts and burning
phenomena [112]. A major success of these models is their good agreement with
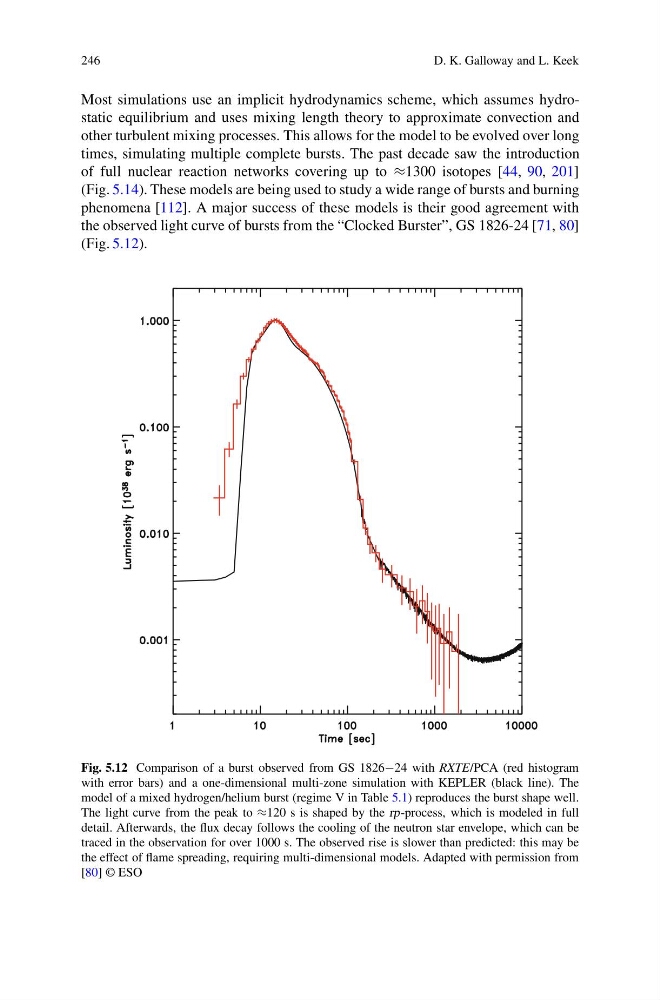
the observed light curve of bursts from the “Clocked Burster”, GS 1826-24 [71, 80]
(Fig. 5.12).
Fig. 5.12 Comparison of a burst observed from GS 1826−24 with RXTE/PCA (red histogram
with error bars) and a one-dimensional multi-zone simulation with KEPLER (black line). The
model of a mixed hydrogen/helium burst (regime V in Table 5.1) reproduces the burst shape well.
The light curve from the peak to ≈120 s is shaped by the rp-process, which is modeled in full
detail. Afterwards, the flux decay follows the cooling of the neutron star envelope, which can be
traced in the observation for over 1000 s. The observed rise is slower than predicted: this may be
the effect of flame spreading, requiring multi-dimensional models. Adapted with permission from
[80] © ESO
D. K. Galloway and L. Keek
Most simulations use an implicit hydrodynamics scheme, which assumes hydrostatic equilibrium and uses mixing length theory to approximate convection and
other turbulent mixing processes. This allows for the model to be evolved over long
times, simulating multiple complete bursts. The past decade saw the introduction
of full nuclear reaction networks covering up to ≈1300 isotopes [44, 90, 201]
(Fig. 5.14). These models are being used to study a wide range of bursts and burning
phenomena [112]. A major success of these models is their good agreement with
the observed light curve of bursts from the “Clocked Burster”, GS 1826-24 [71, 80]
(Fig. 5.12).
Fig. 5.12 Comparison of a burst observed from GS 1826−24 with RXTE/PCA (red histogram
with error bars) and a one-dimensional multi-zone simulation with KEPLER (black line). The
model of a mixed hydrogen/helium burst (regime V in Table 5.1) reproduces the burst shape well.
The light curve from the peak to ≈120 s is shaped by the rp-process, which is modeled in full
detail. Afterwards, the flux decay follows the cooling of the neutron star envelope, which can be
traced in the observation for over 1000 s. The observed rise is slower than predicted: this may be
the effect of flame spreading, requiring multi-dimensional models. Adapted with permission from
[80] © ESO