

5 Thermonuclear X-ray Bursts
237
5.6.1 Observations of mHz QPOs
QPOs at frequencies of 5–10 mHz with fractional amplitudes of ≈2% have
been detected in observations of 5 bursting sources: 4U 1636−536, Aql X-1,
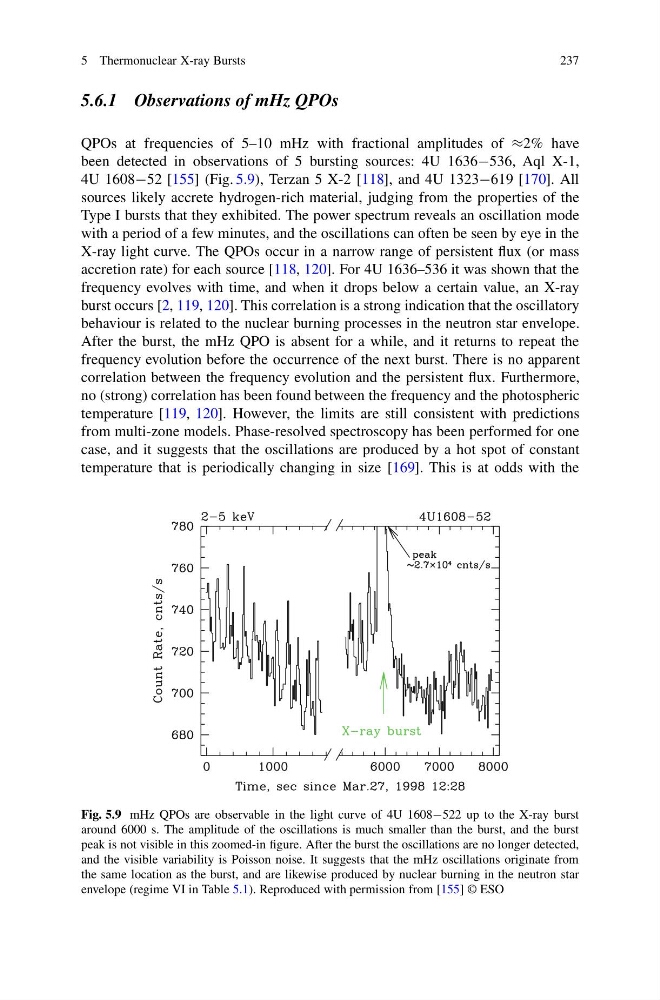
4U 1608−52 [155] (Fig. 5.9), Terzan 5 X-2 [118], and 4U 1323−619 [170]. All
sources likely accrete hydrogen-rich material, judging from the properties of the
Type I bursts that they exhibited. The power spectrum reveals an oscillation mode
with a period of a few minutes, and the oscillations can often be seen by eye in the
X-ray light curve. The QPOs occur in a narrow range of persistent flux (or mass
accretion rate) for each source [118, 120]. For 4U 1636–536 it was shown that the
frequency evolves with time, and when it drops below a certain value, an X-ray
burst occurs [2, 119, 120]. This correlation is a strong indication that the oscillatory
behaviour is related to the nuclear burning processes in the neutron star envelope.
After the burst, the mHz QPO is absent for a while, and it returns to repeat the
frequency evolution before the occurrence of the next burst. There is no apparent
correlation between the frequency evolution and the persistent flux. Furthermore,
no (strong) correlation has been found between the frequency and the photospheric
temperature [119, 120]. However, the limits are still consistent with predictions
from multi-zone models. Phase-resolved spectroscopy has been performed for one
case, and it suggests that the oscillations are produced by a hot spot of constant
temperature that is periodically changing in size [169]. This is at odds with the
Fig. 5.9 mHz QPOs are observable in the light curve of 4U 1608−522 up to the X-ray burst
around 6000 s. The amplitude of the oscillations is much smaller than the burst, and the burst
peak is not visible in this zoomed-in figure. After the burst the oscillations are no longer detected,
and the visible variability is Poisson noise. It suggests that the mHz oscillations originate from
the same location as the burst, and are likewise produced by nuclear burning in the neutron star
envelope (regime VI in Table 5.1). Reproduced with permission from [155] © ESO
237
5.6.1 Observations of mHz QPOs
QPOs at frequencies of 5–10 mHz with fractional amplitudes of ≈2% have
been detected in observations of 5 bursting sources: 4U 1636−536, Aql X-1,
4U 1608−52 [155] (Fig. 5.9), Terzan 5 X-2 [118], and 4U 1323−619 [170]. All
sources likely accrete hydrogen-rich material, judging from the properties of the
Type I bursts that they exhibited. The power spectrum reveals an oscillation mode
with a period of a few minutes, and the oscillations can often be seen by eye in the
X-ray light curve. The QPOs occur in a narrow range of persistent flux (or mass
accretion rate) for each source [118, 120]. For 4U 1636–536 it was shown that the
frequency evolves with time, and when it drops below a certain value, an X-ray
burst occurs [2, 119, 120]. This correlation is a strong indication that the oscillatory
behaviour is related to the nuclear burning processes in the neutron star envelope.
After the burst, the mHz QPO is absent for a while, and it returns to repeat the
frequency evolution before the occurrence of the next burst. There is no apparent
correlation between the frequency evolution and the persistent flux. Furthermore,
no (strong) correlation has been found between the frequency and the photospheric
temperature [119, 120]. However, the limits are still consistent with predictions
from multi-zone models. Phase-resolved spectroscopy has been performed for one
case, and it suggests that the oscillations are produced by a hot spot of constant
temperature that is periodically changing in size [169]. This is at odds with the
Fig. 5.9 mHz QPOs are observable in the light curve of 4U 1608−522 up to the X-ray burst
around 6000 s. The amplitude of the oscillations is much smaller than the burst, and the burst
peak is not visible in this zoomed-in figure. After the burst the oscillations are no longer detected,
and the visible variability is Poisson noise. It suggests that the mHz oscillations originate from
the same location as the burst, and are likewise produced by nuclear burning in the neutron star
envelope (regime VI in Table 5.1). Reproduced with permission from [155] © ESO