

5 Thermonuclear X-ray Bursts
219
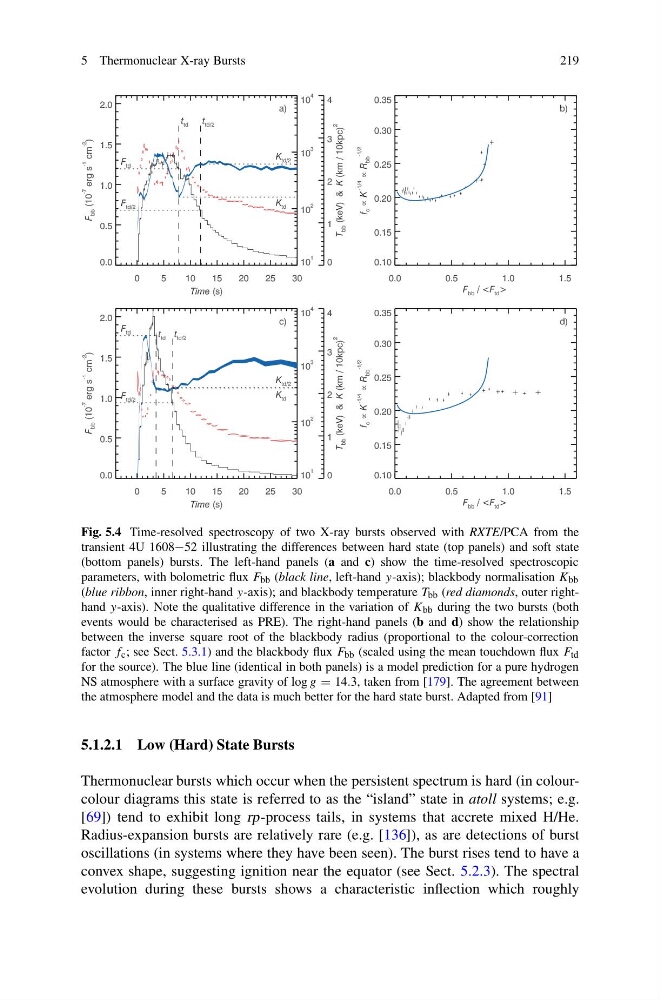
Fig. 5.4 Time-resolved spectroscopy of two X-ray bursts observed with RXTE/PCA from the
transient 4U 1608−52 illustrating the differences between hard state (top panels) and soft state
(bottom panels) bursts. The left-hand panels (a and c) show the time-resolved spectroscopic
parameters, with bolometric flux F bb (black line, left-hand y-axis); blackbody normalisation K bb
(blue ribbon, inner right-hand y-axis); and blackbody temperature T bb (red diamonds, outer righthand y-axis). Note the qualitative difference in the variation of K bb during the two bursts (both
events would be characterised as PRE). The right-hand panels (b and d) show the relationship
between the inverse square root of the blackbody radius (proportional to the colour-correction
factor f c ; see Sect. 5.3.1) and the blackbody flux F bb (scaled using the mean touchdown flux F td
for the source). The blue line (identical in both panels) is a model prediction for a pure hydrogen
NS atmosphere with a surface gravity of log g = 14.3, taken from [179]. The agreement between
the atmosphere model and the data is much better for the hard state burst. Adapted from [91]
5.1.2.1 Low (Hard) State Bursts
Thermonuclear bursts which occur when the persistent spectrum is hard (in colourcolour diagrams this state is referred to as the “island” state in atoll systems; e.g.
[69]) tend to exhibit long rp-process tails, in systems that accrete mixed H/He.
Radius-expansion bursts are relatively rare (e.g. [136]), as are detections of burst
oscillations (in systems where they have been seen). The burst rises tend to have a
convex shape, suggesting ignition near the equator (see Sect. 5.2.3). The spectral
evolution during these bursts shows a characteristic inflection which roughly
219
Fig. 5.4 Time-resolved spectroscopy of two X-ray bursts observed with RXTE/PCA from the
transient 4U 1608−52 illustrating the differences between hard state (top panels) and soft state
(bottom panels) bursts. The left-hand panels (a and c) show the time-resolved spectroscopic
parameters, with bolometric flux F bb (black line, left-hand y-axis); blackbody normalisation K bb
(blue ribbon, inner right-hand y-axis); and blackbody temperature T bb (red diamonds, outer righthand y-axis). Note the qualitative difference in the variation of K bb during the two bursts (both
events would be characterised as PRE). The right-hand panels (b and d) show the relationship
between the inverse square root of the blackbody radius (proportional to the colour-correction
factor f c ; see Sect. 5.3.1) and the blackbody flux F bb (scaled using the mean touchdown flux F td
for the source). The blue line (identical in both panels) is a model prediction for a pure hydrogen
NS atmosphere with a surface gravity of log g = 14.3, taken from [179]. The agreement between
the atmosphere model and the data is much better for the hard state burst. Adapted from [91]
5.1.2.1 Low (Hard) State Bursts
Thermonuclear bursts which occur when the persistent spectrum is hard (in colourcolour diagrams this state is referred to as the “island” state in atoll systems; e.g.
[69]) tend to exhibit long rp-process tails, in systems that accrete mixed H/He.
Radius-expansion bursts are relatively rare (e.g. [136]), as are detections of burst
oscillations (in systems where they have been seen). The burst rises tend to have a
convex shape, suggesting ignition near the equator (see Sect. 5.2.3). The spectral
evolution during these bursts shows a characteristic inflection which roughly