

4 Accreting Millisecond X-ray Pulsars
157
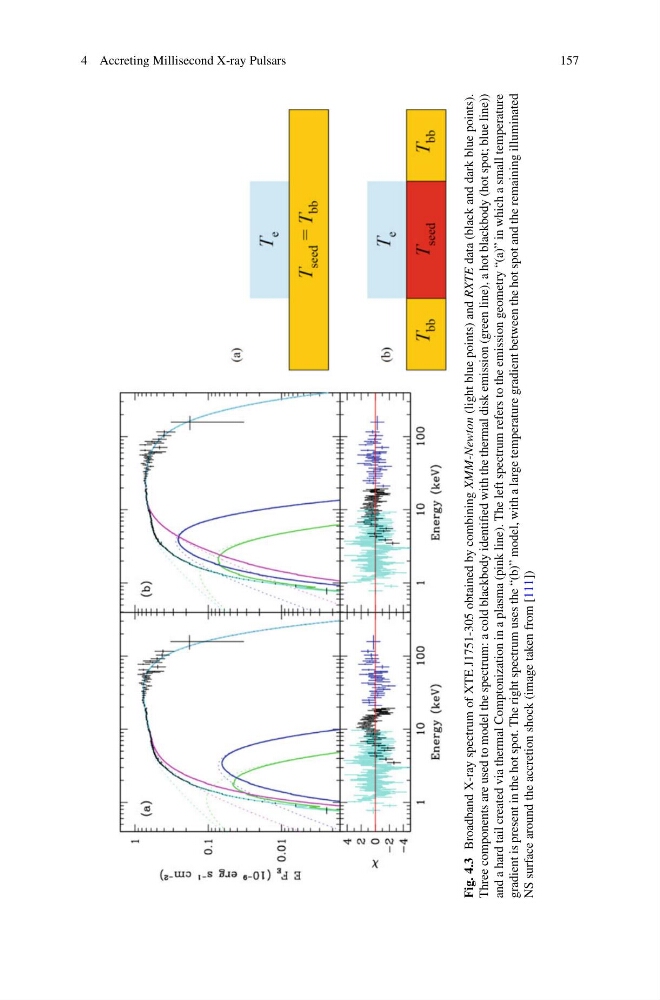
Fig. 4.3
Broadband X-ray spectrum of XTE J1751-305 obtained by combining XMM-Newton
(light blue points) and RXTE
data (black and dark blue points).
Three components are used to model the spectrum: a cold blackbody identified with the thermal disk emission (green line), a hot blackbody (hot spot; blue line))
and a hard tail created via thermal Comptonization in a plasma (pink line). The left spectrum refers to the emission geometry “(a)” in which a small temperature
gradient is present in the hot spot. The right spectrum uses the “(b)” model, with a large temperature gradient between the hot spot and the remaining illuminated
NS surface around the accretion shock (image taken from [111])
157
Fig. 4.3
Broadband X-ray spectrum of XTE J1751-305 obtained by combining XMM-Newton
(light blue points) and RXTE
data (black and dark blue points).
Three components are used to model the spectrum: a cold blackbody identified with the thermal disk emission (green line), a hot blackbody (hot spot; blue line))
and a hard tail created via thermal Comptonization in a plasma (pink line). The left spectrum refers to the emission geometry “(a)” in which a small temperature
gradient is present in the hot spot. The right spectrum uses the “(b)” model, with a large temperature gradient between the hot spot and the remaining illuminated
NS surface around the accretion shock (image taken from [111])