

3 Magnetars: A Short Review and Some Sparse Considerations
109
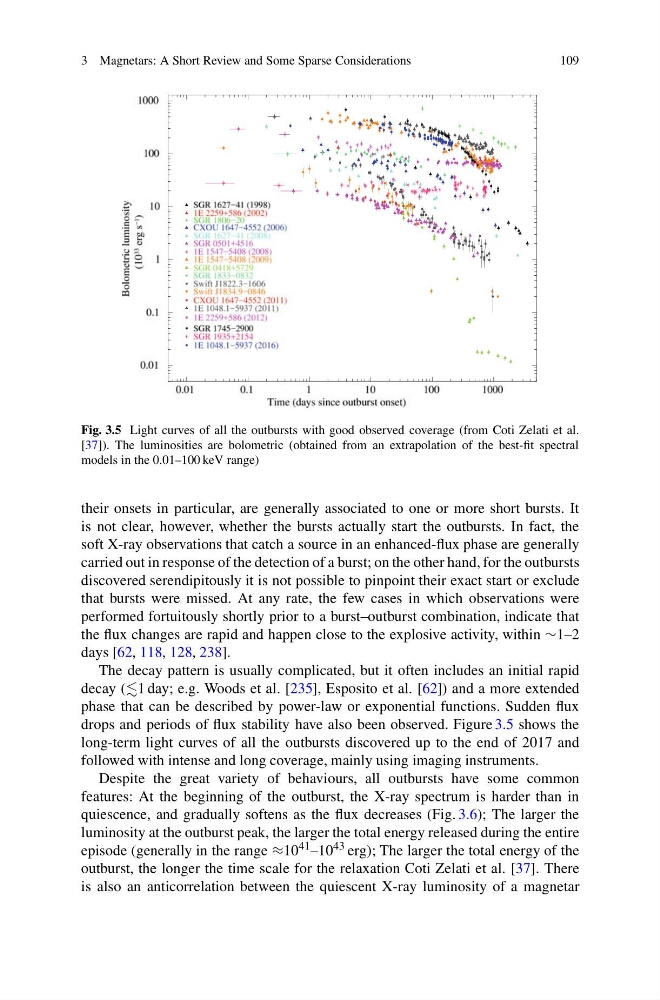
Fig. 3.5 Light curves of all the outbursts with good observed coverage (from Coti Zelati et al.
[37]). The luminosities are bolometric (obtained from an extrapolation of the best-fit spectral
models in the 0.01–100 keV range)
their onsets in particular, are generally associated to one or more short bursts. It
is not clear, however, whether the bursts actually start the outbursts. In fact, the
soft X-ray observations that catch a source in an enhanced-flux phase are generally
carried out in response of the detection of a burst; on the other hand, for the outbursts
discovered serendipitously it is not possible to pinpoint their exact start or exclude
that bursts were missed. At any rate, the few cases in which observations were
performed fortuitously shortly prior to a burst–outburst combination, indicate that
the flux changes are rapid and happen close to the explosive activity, within ∼1–2
days [62, 118, 128, 238].
The decay pattern is usually complicated, but it often includes an initial rapid
decay (1 day; e.g. Woods et al. [235], Esposito et al. [62]) and a more extended
phase that can be described by power-law or exponential functions. Sudden flux
drops and periods of flux stability have also been observed. Figure 3.5 shows the
long-term light curves of all the outbursts discovered up to the end of 2017 and
followed with intense and long coverage, mainly using imaging instruments.
Despite the great variety of behaviours, all outbursts have some common
features: At the beginning of the outburst, the X-ray spectrum is harder than in
quiescence, and gradually softens as the flux decreases (Fig. 3.6); The larger the
luminosity at the outburst peak, the larger the total energy released during the entire
episode (generally in the range ≈10 41 –10 43 erg); The larger the total energy of the
outburst, the longer the time scale for the relaxation Coti Zelati et al. [37]. There
is also an anticorrelation between the quiescent X-ray luminosity of a magnetar
109
Fig. 3.5 Light curves of all the outbursts with good observed coverage (from Coti Zelati et al.
[37]). The luminosities are bolometric (obtained from an extrapolation of the best-fit spectral
models in the 0.01–100 keV range)
their onsets in particular, are generally associated to one or more short bursts. It
is not clear, however, whether the bursts actually start the outbursts. In fact, the
soft X-ray observations that catch a source in an enhanced-flux phase are generally
carried out in response of the detection of a burst; on the other hand, for the outbursts
discovered serendipitously it is not possible to pinpoint their exact start or exclude
that bursts were missed. At any rate, the few cases in which observations were
performed fortuitously shortly prior to a burst–outburst combination, indicate that
the flux changes are rapid and happen close to the explosive activity, within ∼1–2
days [62, 118, 128, 238].
The decay pattern is usually complicated, but it often includes an initial rapid
decay (1 day; e.g. Woods et al. [235], Esposito et al. [62]) and a more extended
phase that can be described by power-law or exponential functions. Sudden flux
drops and periods of flux stability have also been observed. Figure 3.5 shows the
long-term light curves of all the outbursts discovered up to the end of 2017 and
followed with intense and long coverage, mainly using imaging instruments.
Despite the great variety of behaviours, all outbursts have some common
features: At the beginning of the outburst, the X-ray spectrum is harder than in
quiescence, and gradually softens as the flux decreases (Fig. 3.6); The larger the
luminosity at the outburst peak, the larger the total energy released during the entire
episode (generally in the range ≈10 41 –10 43 erg); The larger the total energy of the
outburst, the longer the time scale for the relaxation Coti Zelati et al. [37]. There
is also an anticorrelation between the quiescent X-ray luminosity of a magnetar