

218
13 Cosmological Preliminaries
Appendix 1: Measured Values for the Hubble Constant
The original Hubble method to obtain H 0 requires that we measure the recession
velocity and the distance to a number of galaxies or other cosmological sources
and then fit a plot of the two to (13.33). The recession velocity is relatively easy to
measure using the Doppler shift of the light. However measuring the distance is not
so simple. It is typically done using a so-called distance ladder; we first use parallax
to measure the distance to nearby sources such as Cepheid variable stars, whose
period varies in a known way with their intrinsic brightness or absolute luminosity,
making them “standard candles.” This makes both the apparent luminosity and the
absolute luminosity of the standard candles measurable, and from that the distance
can be calculated; the next step on the ladder is to use the Cepheid variable stars
to measure the distance and brightness of type 1a supernovae whose spectra can be
correlated with their absolute luminosity so that they also serve as standard candles.
The result is that we can determine the absolute luminosity of yet more distant
supernovae by observing their time spectra, and the combination of apparent and
absolute luminosity then gives their distance. The basic idea is further discussed in
Chap. 12 of Schutz (2009) and a recent detailed application is in Reiss (2019).
Another approach to obtaining H 0 is to use red giant stars as standard candles
(Freedman 2019). The gravitational lensing of galaxies can also be used to measure
the distance to a source; the basic idea is discussed in Schutz (2009) and the application to measuring H 0 in Chen (2019). Also see Exercise 13.17 on lensing. Finally,
the collision and merger of black holes and neutron stars provide “standard sirens”
that allow a measurement of H 0 from observations of the gravitational waves they
emit (Holz 2018, 2005; Schutz 1986).
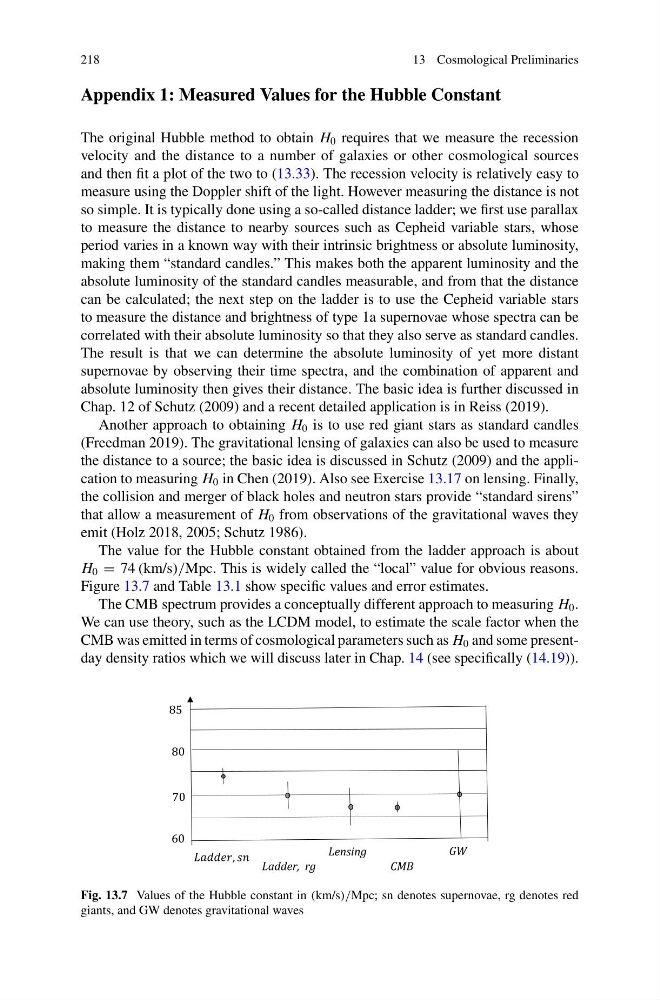
The value for the Hubble constant obtained from the ladder approach is about
H 0 = 74 (km/s)/Mpc. This is widely called the “local” value for obvious reasons.
Figure 13.7 and Table 13.1 show specific values and error estimates.
The CMB spectrum provides a conceptually different approach to measuring H 0 .
We can use theory, such as the LCDM model, to estimate the scale factor when the
CMB was emitted in terms of cosmological parameters such as H 0 and some presentday density ratios which we will discuss later in Chap. 14 (see specifically (14.19)).
Fig. 13.7 Values of the Hubble constant in (km/s)/Mpc; sn denotes supernovae, rg denotes red
giants, and GW denotes gravitational waves
13 Cosmological Preliminaries
Appendix 1: Measured Values for the Hubble Constant
The original Hubble method to obtain H 0 requires that we measure the recession
velocity and the distance to a number of galaxies or other cosmological sources
and then fit a plot of the two to (13.33). The recession velocity is relatively easy to
measure using the Doppler shift of the light. However measuring the distance is not
so simple. It is typically done using a so-called distance ladder; we first use parallax
to measure the distance to nearby sources such as Cepheid variable stars, whose
period varies in a known way with their intrinsic brightness or absolute luminosity,
making them “standard candles.” This makes both the apparent luminosity and the
absolute luminosity of the standard candles measurable, and from that the distance
can be calculated; the next step on the ladder is to use the Cepheid variable stars
to measure the distance and brightness of type 1a supernovae whose spectra can be
correlated with their absolute luminosity so that they also serve as standard candles.
The result is that we can determine the absolute luminosity of yet more distant
supernovae by observing their time spectra, and the combination of apparent and
absolute luminosity then gives their distance. The basic idea is further discussed in
Chap. 12 of Schutz (2009) and a recent detailed application is in Reiss (2019).
Another approach to obtaining H 0 is to use red giant stars as standard candles
(Freedman 2019). The gravitational lensing of galaxies can also be used to measure
the distance to a source; the basic idea is discussed in Schutz (2009) and the application to measuring H 0 in Chen (2019). Also see Exercise 13.17 on lensing. Finally,
the collision and merger of black holes and neutron stars provide “standard sirens”
that allow a measurement of H 0 from observations of the gravitational waves they
emit (Holz 2018, 2005; Schutz 1986).
The value for the Hubble constant obtained from the ladder approach is about
H 0 = 74 (km/s)/Mpc. This is widely called the “local” value for obvious reasons.
Figure 13.7 and Table 13.1 show specific values and error estimates.
The CMB spectrum provides a conceptually different approach to measuring H 0 .
We can use theory, such as the LCDM model, to estimate the scale factor when the
CMB was emitted in terms of cosmological parameters such as H 0 and some presentday density ratios which we will discuss later in Chap. 14 (see specifically (14.19)).
Fig. 13.7 Values of the Hubble constant in (km/s)/Mpc; sn denotes supernovae, rg denotes red
giants, and GW denotes gravitational waves