

162
Y. Li et al.
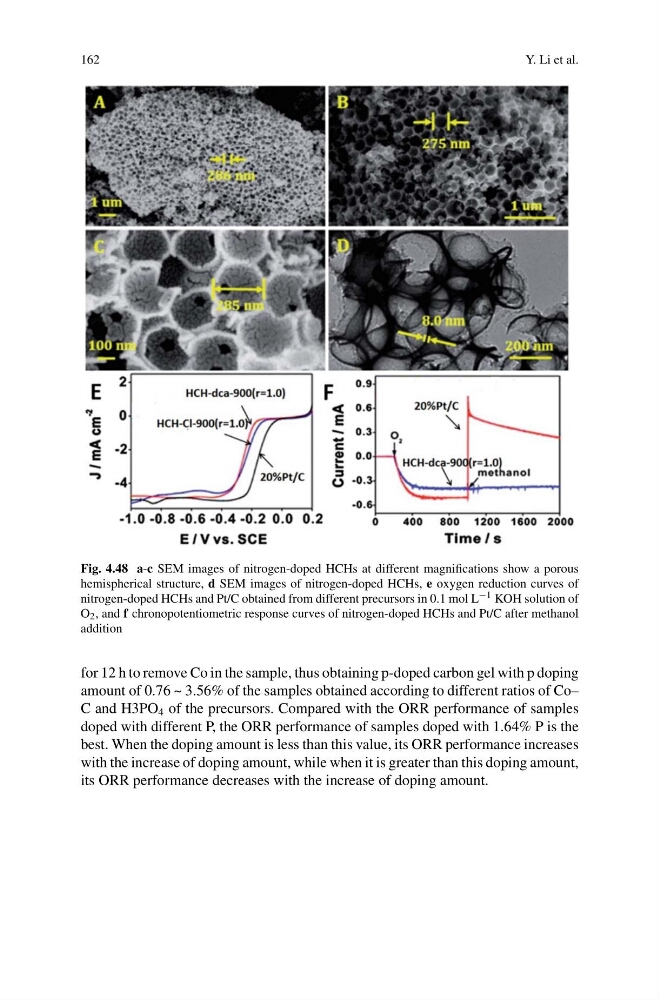
Fig. 4.48 a-c SEM images of nitrogen-doped HCHs at different magnifications show a porous
hemispherical structure, d SEM images of nitrogen-doped HCHs, e oxygen reduction curves of
nitrogen-doped HCHs and Pt/C obtained from different precursors in 0.1 mol L −1 KOH solution of
O 2 , and f chronopotentiometric response curves of nitrogen-doped HCHs and Pt/C after methanol
addition
for 12 h to remove Co in the sample, thus obtaining p-doped carbon gel with p doping
amount of 0.76 ~ 3.56% of the samples obtained according to different ratios of Co–
C and H3PO 4 of the precursors. Compared with the ORR performance of samples
doped with different P, the ORR performance of samples doped with 1.64% P is the
best. When the doping amount is less than this value, its ORR performance increases
with the increase of doping amount, while when it is greater than this doping amount,
its ORR performance decreases with the increase of doping amount.
Y. Li et al.
Fig. 4.48 a-c SEM images of nitrogen-doped HCHs at different magnifications show a porous
hemispherical structure, d SEM images of nitrogen-doped HCHs, e oxygen reduction curves of
nitrogen-doped HCHs and Pt/C obtained from different precursors in 0.1 mol L −1 KOH solution of
O 2 , and f chronopotentiometric response curves of nitrogen-doped HCHs and Pt/C after methanol
addition
for 12 h to remove Co in the sample, thus obtaining p-doped carbon gel with p doping
amount of 0.76 ~ 3.56% of the samples obtained according to different ratios of Co–
C and H3PO 4 of the precursors. Compared with the ORR performance of samples
doped with different P, the ORR performance of samples doped with 1.64% P is the
best. When the doping amount is less than this value, its ORR performance increases
with the increase of doping amount, while when it is greater than this doping amount,
its ORR performance decreases with the increase of doping amount.