

9 Mössbauer Spectroscopic Studies on Atomic Diffusion in Materials
503
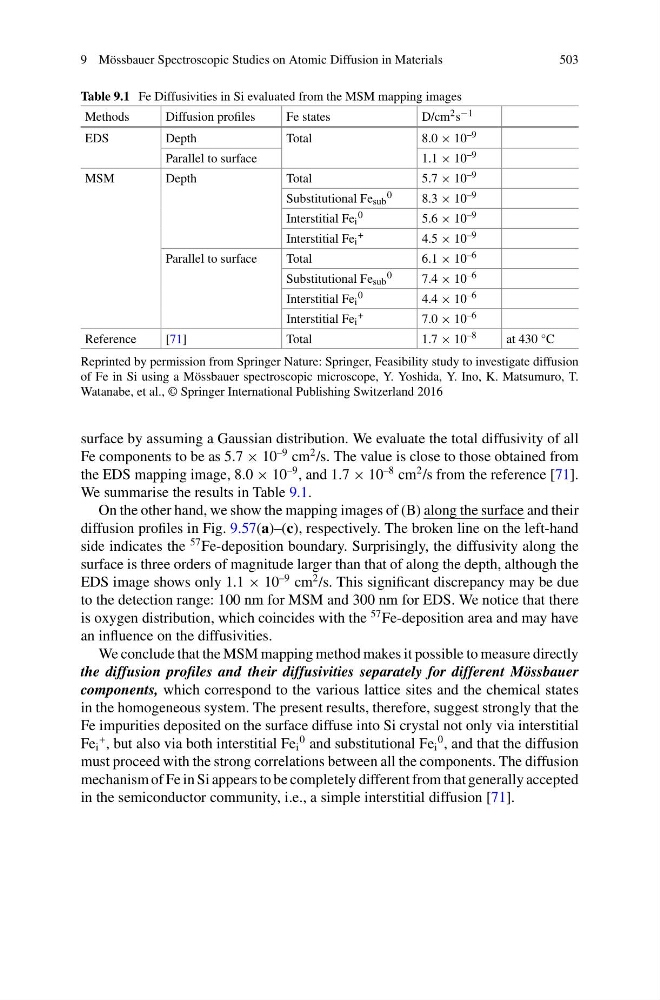
Table 9.1 Fe Diffusivities in Si evaluated from the MSM mapping images
Methods
Diffusion profiles
Fe states
D/cm 2 s −1
EDS
Depth
Total
8.0 × 10 –9
Parallel to surface
1.1 × 10 –9
MSM
Depth
Total
5.7 × 10 –9
Substitutional Fe sub
0
8.3 × 10 –9
Interstitial Fe i
0
5.6 × 10 –9
Interstitial Fe i
+
4.5 × 10 –9
Parallel to surface
Total
6.1 × 10 –6
Substitutional Fe sub
0
7.4 × 10 –6
Interstitial Fe i
0
4.4 × 10 –6
Interstitial Fe i
+
7.0 × 10 –6
Reference
[71]
Total
1.7 × 10 –8
at 430 °C
Reprinted by permission from Springer Nature: Springer, Feasibility study to investigate diffusion
of Fe in Si using a Mössbauer spectroscopic microscope, Y. Yoshida, Y. Ino, K. Matsumuro, T.
Watanabe, et al., © Springer International Publishing Switzerland 2016
surface by assuming a Gaussian distribution. We evaluate the total diffusivity of all
Fe components to be as 5.7 × 10
–9 cm
2 /s. The value is close to those obtained from
the EDS mapping image, 8.0 × 10
–9 , and 1.7 × 10
–8 cm
2 /s from the reference [71].
We summarise the results in Table 9.1.
On the other hand, we show the mapping images of (B) along the surface and their
diffusion profiles in Fig. 9.57(a)–(c), respectively. The broken line on the left-hand
side indicates the
57 Fe-deposition boundary. Surprisingly, the diffusivity along the
surface is three orders of magnitude larger than that of along the depth, although the
EDS image shows only 1.1 × 10
–9 cm
2 /s. This significant discrepancy may be due
to the detection range: 100 nm for MSM and 300 nm for EDS. We notice that there
is oxygen distribution, which coincides with the
57 Fe-deposition area and may have
an influence on the diffusivities.
We conclude that the MSM mapping method makes it possible to measure directly
the diffusion profiles and their diffusivities separately for different Mössbauer
components, which correspond to the various lattice sites and the chemical states
in the homogeneous system. The present results, therefore, suggest strongly that the
Fe impurities deposited on the surface diffuse into Si crystal not only via interstitial
Fe i
+ , but also via both interstitial Fe i
0 and substitutional Fe i
0 , and that the diffusion
must proceed with the strong correlations between all the components. The diffusion
mechanism of Fe in Si appears to be completely different from that generally accepted
in the semiconductor community, i.e., a simple interstitial diffusion [71].
503
Table 9.1 Fe Diffusivities in Si evaluated from the MSM mapping images
Methods
Diffusion profiles
Fe states
D/cm 2 s −1
EDS
Depth
Total
8.0 × 10 –9
Parallel to surface
1.1 × 10 –9
MSM
Depth
Total
5.7 × 10 –9
Substitutional Fe sub
0
8.3 × 10 –9
Interstitial Fe i
0
5.6 × 10 –9
Interstitial Fe i
+
4.5 × 10 –9
Parallel to surface
Total
6.1 × 10 –6
Substitutional Fe sub
0
7.4 × 10 –6
Interstitial Fe i
0
4.4 × 10 –6
Interstitial Fe i
+
7.0 × 10 –6
Reference
[71]
Total
1.7 × 10 –8
at 430 °C
Reprinted by permission from Springer Nature: Springer, Feasibility study to investigate diffusion
of Fe in Si using a Mössbauer spectroscopic microscope, Y. Yoshida, Y. Ino, K. Matsumuro, T.
Watanabe, et al., © Springer International Publishing Switzerland 2016
surface by assuming a Gaussian distribution. We evaluate the total diffusivity of all
Fe components to be as 5.7 × 10
–9 cm
2 /s. The value is close to those obtained from
the EDS mapping image, 8.0 × 10
–9 , and 1.7 × 10
–8 cm
2 /s from the reference [71].
We summarise the results in Table 9.1.
On the other hand, we show the mapping images of (B) along the surface and their
diffusion profiles in Fig. 9.57(a)–(c), respectively. The broken line on the left-hand
side indicates the
57 Fe-deposition boundary. Surprisingly, the diffusivity along the
surface is three orders of magnitude larger than that of along the depth, although the
EDS image shows only 1.1 × 10
–9 cm
2 /s. This significant discrepancy may be due
to the detection range: 100 nm for MSM and 300 nm for EDS. We notice that there
is oxygen distribution, which coincides with the
57 Fe-deposition area and may have
an influence on the diffusivities.
We conclude that the MSM mapping method makes it possible to measure directly
the diffusion profiles and their diffusivities separately for different Mössbauer
components, which correspond to the various lattice sites and the chemical states
in the homogeneous system. The present results, therefore, suggest strongly that the
Fe impurities deposited on the surface diffuse into Si crystal not only via interstitial
Fe i
+ , but also via both interstitial Fe i
0 and substitutional Fe i
0 , and that the diffusion
must proceed with the strong correlations between all the components. The diffusion
mechanism of Fe in Si appears to be completely different from that generally accepted
in the semiconductor community, i.e., a simple interstitial diffusion [71].