

354
P.-E. Lippens
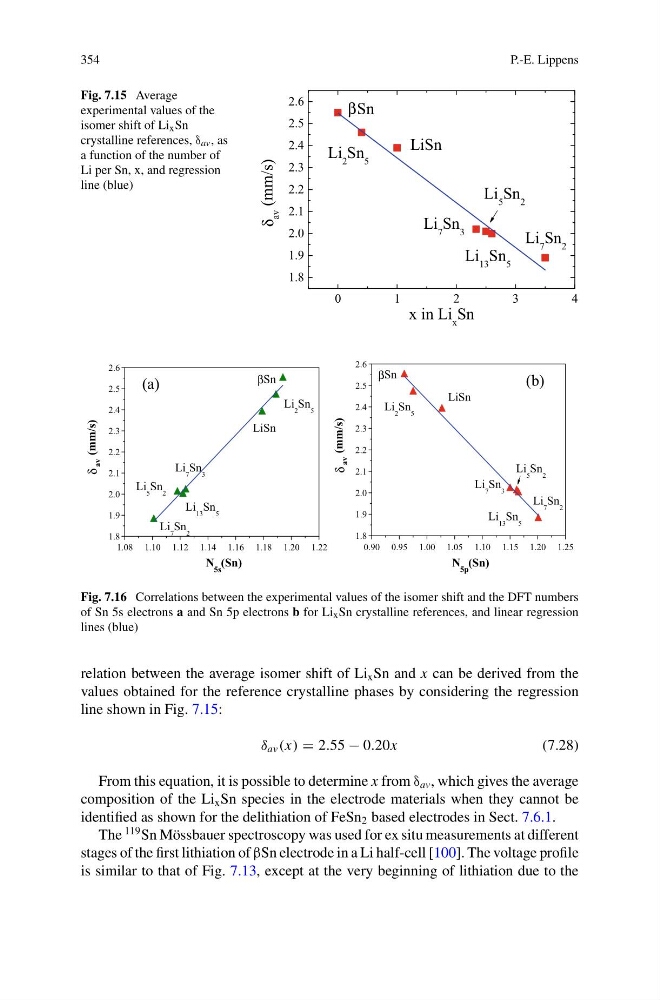
Fig. 7.15 Average
experimental values of the
isomer shift of Li x Sn
crystalline references, δ av , as
a function of the number of
Li per Sn, x, and regression
line (blue)
0
1
2
3
4
1.8
1.9
2.0
2.1
2.2
2.3
2.4
2.5
2.6
av
(mm/s)
Sn
Li 13 Sn 5
Li 7 Sn 3
Li 7 Sn 2
LiSn
Li 5 Sn 2
Li 2 Sn 5
x in Li x Sn
δ
β
1.8
1.9
2.0
2.1
2.2
2.3
2.4
2.5
2.6
Sn
Li 2 Sn 5
LiSn
Li 5 Sn 2
Li 7 Sn 3
Li 13 Sn 5
Li 7 Sn 2
av
(mm/s)
N 5s (Sn)
1.08 1.10 1.12 1.14 1.16 1.18 1.20 1.22
0.90 0.95 1.00 1.05 1.10 1.15 1.20 1.25
1.8
1.9
2.0
2.1
2.2
2.3
2.4
2.5
2.6
Sn
Li 2 Sn 5
LiSn
Li 5 Sn 2
Li 7 Sn 3
Li 13 Sn 5
Li 7 Sn 2
av
(mm/s)
N 5p (Sn)
(a)
(b)
β
β
Fig. 7.16 Correlations between the experimental values of the isomer shift and the DFT numbers
of Sn 5s electrons a and Sn 5p electrons b for Li x Sn crystalline references, and linear regression
lines (blue)
relation between the average isomer shift of Li x Sn and x can be derived from the
values obtained for the reference crystalline phases by considering the regression
line shown in Fig. 7.15:
δ av (x) = 2.55 − 0.20x
(7.28)
From this equation, it is possible to determine x from δ av , which gives the average
composition of the Li x Sn species in the electrode materials when they cannot be
identified as shown for the delithiation of FeSn 2 based electrodes in Sect. 7.6.1.
The
119 Sn Mössbauer spectroscopy was used for ex situ measurements at different
stages of the first lithiation of βSn electrode in a Li half-cell [100]. The voltage profile
is similar to that of Fig. 7.13, except at the very beginning of lithiation due to the
P.-E. Lippens
Fig. 7.15 Average
experimental values of the
isomer shift of Li x Sn
crystalline references, δ av , as
a function of the number of
Li per Sn, x, and regression
line (blue)
0
1
2
3
4
1.8
1.9
2.0
2.1
2.2
2.3
2.4
2.5
2.6
av
(mm/s)
Sn
Li 13 Sn 5
Li 7 Sn 3
Li 7 Sn 2
LiSn
Li 5 Sn 2
Li 2 Sn 5
x in Li x Sn
δ
β
1.8
1.9
2.0
2.1
2.2
2.3
2.4
2.5
2.6
Sn
Li 2 Sn 5
LiSn
Li 5 Sn 2
Li 7 Sn 3
Li 13 Sn 5
Li 7 Sn 2
av
(mm/s)
N 5s (Sn)
1.08 1.10 1.12 1.14 1.16 1.18 1.20 1.22
0.90 0.95 1.00 1.05 1.10 1.15 1.20 1.25
1.8
1.9
2.0
2.1
2.2
2.3
2.4
2.5
2.6
Sn
Li 2 Sn 5
LiSn
Li 5 Sn 2
Li 7 Sn 3
Li 13 Sn 5
Li 7 Sn 2
av
(mm/s)
N 5p (Sn)
(a)
(b)
β
β
Fig. 7.16 Correlations between the experimental values of the isomer shift and the DFT numbers
of Sn 5s electrons a and Sn 5p electrons b for Li x Sn crystalline references, and linear regression
lines (blue)
relation between the average isomer shift of Li x Sn and x can be derived from the
values obtained for the reference crystalline phases by considering the regression
line shown in Fig. 7.15:
δ av (x) = 2.55 − 0.20x
(7.28)
From this equation, it is possible to determine x from δ av , which gives the average
composition of the Li x Sn species in the electrode materials when they cannot be
identified as shown for the delithiation of FeSn 2 based electrodes in Sect. 7.6.1.
The
119 Sn Mössbauer spectroscopy was used for ex situ measurements at different
stages of the first lithiation of βSn electrode in a Li half-cell [100]. The voltage profile
is similar to that of Fig. 7.13, except at the very beginning of lithiation due to the