

4 From Small Molecules to Complex Systems: A Survey of Chemical …
201
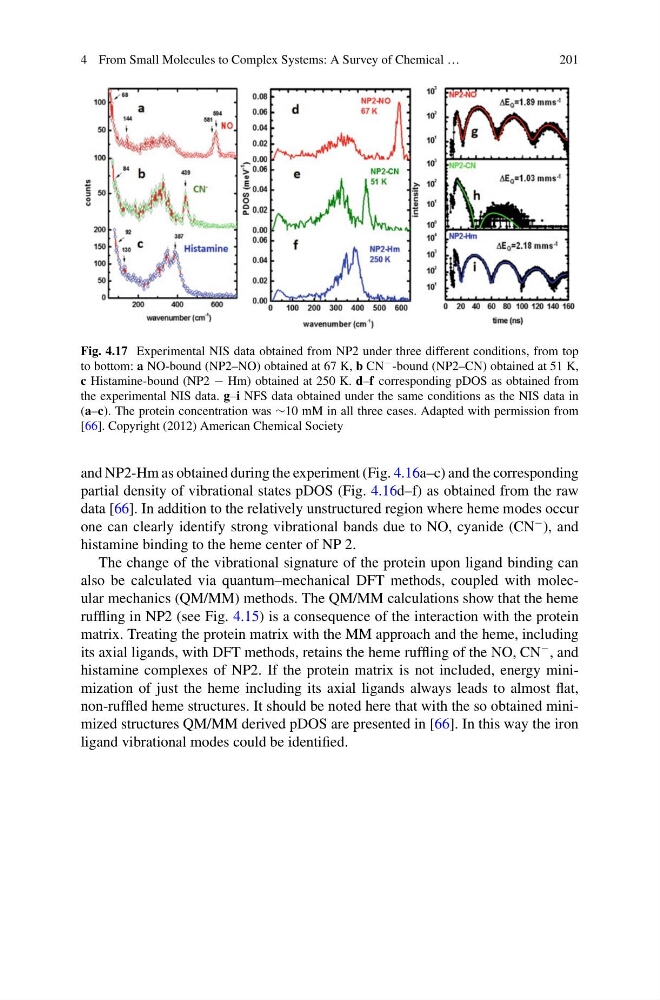
Fig. 4.17 Experimental NIS data obtained from NP2 under three different conditions, from top
to bottom: a NO-bound (NP2–NO) obtained at 67 K, b CN − -bound (NP2–CN) obtained at 51 K,
c Histamine-bound (NP2 − Hm) obtained at 250 K. d–f corresponding pDOS as obtained from
the experimental NIS data. g–i NFS data obtained under the same conditions as the NIS data in
(a–c). The protein concentration was ∼10 mM in all three cases. Adapted with permission from
[66]. Copyright (2012) American Chemical Society
and NP2-Hm as obtained during the experiment (Fig. 4.16a–c) and the corresponding
partial density of vibrational states pDOS (Fig. 4.16d–f) as obtained from the raw
data [66]. In addition to the relatively unstructured region where heme modes occur
one can clearly identify strong vibrational bands due to NO, cyanide (CN
− ), and
histamine binding to the heme center of NP 2.
The change of the vibrational signature of the protein upon ligand binding can
also be calculated via quantum–mechanical DFT methods, coupled with molecular mechanics (QM/MM) methods. The QM/MM calculations show that the heme
ruffling in NP2 (see Fig. 4.15) is a consequence of the interaction with the protein
matrix. Treating the protein matrix with the MM approach and the heme, including
its axial ligands, with DFT methods, retains the heme ruffling of the NO, CN
− , and
histamine complexes of NP2. If the protein matrix is not included, energy minimization of just the heme including its axial ligands always leads to almost flat,
non-ruffled heme structures. It should be noted here that with the so obtained minimized structures QM/MM derived pDOS are presented in [66]. In this way the iron
ligand vibrational modes could be identified.
201
Fig. 4.17 Experimental NIS data obtained from NP2 under three different conditions, from top
to bottom: a NO-bound (NP2–NO) obtained at 67 K, b CN − -bound (NP2–CN) obtained at 51 K,
c Histamine-bound (NP2 − Hm) obtained at 250 K. d–f corresponding pDOS as obtained from
the experimental NIS data. g–i NFS data obtained under the same conditions as the NIS data in
(a–c). The protein concentration was ∼10 mM in all three cases. Adapted with permission from
[66]. Copyright (2012) American Chemical Society
and NP2-Hm as obtained during the experiment (Fig. 4.16a–c) and the corresponding
partial density of vibrational states pDOS (Fig. 4.16d–f) as obtained from the raw
data [66]. In addition to the relatively unstructured region where heme modes occur
one can clearly identify strong vibrational bands due to NO, cyanide (CN
− ), and
histamine binding to the heme center of NP 2.
The change of the vibrational signature of the protein upon ligand binding can
also be calculated via quantum–mechanical DFT methods, coupled with molecular mechanics (QM/MM) methods. The QM/MM calculations show that the heme
ruffling in NP2 (see Fig. 4.15) is a consequence of the interaction with the protein
matrix. Treating the protein matrix with the MM approach and the heme, including
its axial ligands, with DFT methods, retains the heme ruffling of the NO, CN
− , and
histamine complexes of NP2. If the protein matrix is not included, energy minimization of just the heme including its axial ligands always leads to almost flat,
non-ruffled heme structures. It should be noted here that with the so obtained minimized structures QM/MM derived pDOS are presented in [66]. In this way the iron
ligand vibrational modes could be identified.