

4 From Small Molecules to Complex Systems: A Survey of Chemical …
195
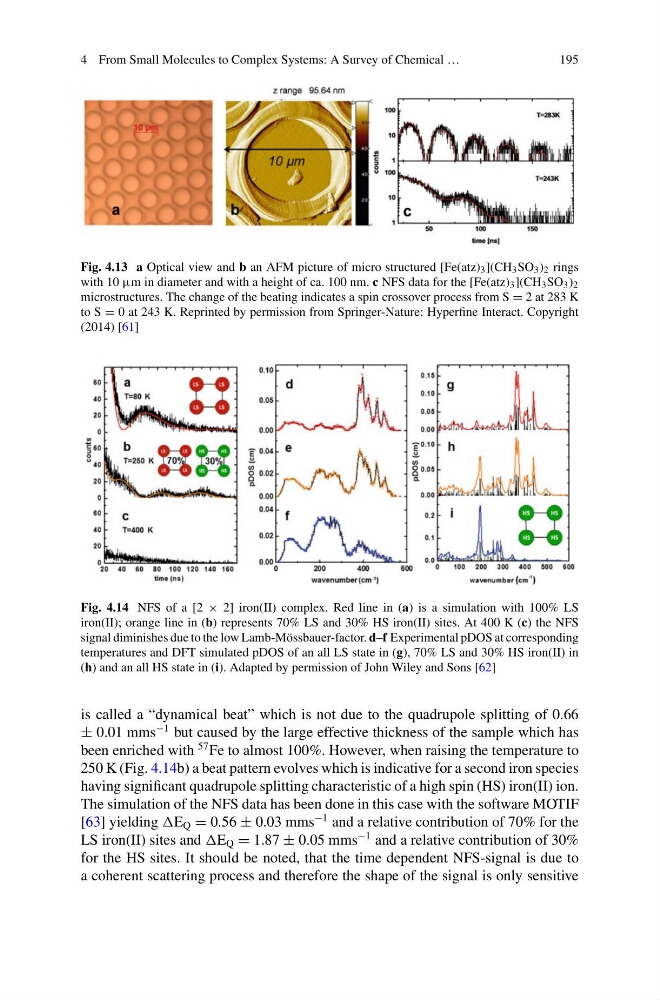
Fig. 4.13 a Optical view and b an AFM picture of micro structured [Fe(atz) 3 ](CH 3 SO 3 ) 2 rings
with 10 μm in diameter and with a height of ca. 100 nm. c NFS data for the [Fe(atz) 3 ](CH 3 SO 3 ) 2
microstructures. The change of the beating indicates a spin crossover process from S = 2 at 283 K
to S = 0 at 243 K. Reprinted by permission from Springer-Nature: Hyperfine Interact. Copyright
(2014) [61]
Fig. 4.14 NFS of a [2 × 2] iron(II) complex. Red line in (a) is a simulation with 100% LS
iron(II); orange line in (b) represents 70% LS and 30% HS iron(II) sites. At 400 K (c) the NFS
signal diminishes due to the low Lamb-Mössbauer-factor. d–f Experimental pDOS at corresponding
temperatures and DFT simulated pDOS of an all LS state in (g), 70% LS and 30% HS iron(II) in
(h) and an all HS state in (i). Adapted by permission of John Wiley and Sons [62]
is called a “dynamical beat” which is not due to the quadrupole splitting of 0.66
± 0.01 mms
−1 but caused by the large effective thickness of the sample which has
been enriched with
57 Fe to almost 100%. However, when raising the temperature to
250 K (Fig. 4.14b) a beat pattern evolves which is indicative for a second iron species
having significant quadrupole splitting characteristic of a high spin (HS) iron(II) ion.
The simulation of the NFS data has been done in this case with the software MOTIF
[63] yielding E Q = 0.56 ± 0.03 mms
−1 and a relative contribution of 70% for the
LS iron(II) sites and E Q = 1.87 ± 0.05 mms
−1 and a relative contribution of 30%
for the HS sites. It should be noted, that the time dependent NFS-signal is due to
a coherent scattering process and therefore the shape of the signal is only sensitive
195
Fig. 4.13 a Optical view and b an AFM picture of micro structured [Fe(atz) 3 ](CH 3 SO 3 ) 2 rings
with 10 μm in diameter and with a height of ca. 100 nm. c NFS data for the [Fe(atz) 3 ](CH 3 SO 3 ) 2
microstructures. The change of the beating indicates a spin crossover process from S = 2 at 283 K
to S = 0 at 243 K. Reprinted by permission from Springer-Nature: Hyperfine Interact. Copyright
(2014) [61]
Fig. 4.14 NFS of a [2 × 2] iron(II) complex. Red line in (a) is a simulation with 100% LS
iron(II); orange line in (b) represents 70% LS and 30% HS iron(II) sites. At 400 K (c) the NFS
signal diminishes due to the low Lamb-Mössbauer-factor. d–f Experimental pDOS at corresponding
temperatures and DFT simulated pDOS of an all LS state in (g), 70% LS and 30% HS iron(II) in
(h) and an all HS state in (i). Adapted by permission of John Wiley and Sons [62]
is called a “dynamical beat” which is not due to the quadrupole splitting of 0.66
± 0.01 mms
−1 but caused by the large effective thickness of the sample which has
been enriched with
57 Fe to almost 100%. However, when raising the temperature to
250 K (Fig. 4.14b) a beat pattern evolves which is indicative for a second iron species
having significant quadrupole splitting characteristic of a high spin (HS) iron(II) ion.
The simulation of the NFS data has been done in this case with the software MOTIF
[63] yielding E Q = 0.56 ± 0.03 mms
−1 and a relative contribution of 70% for the
LS iron(II) sites and E Q = 1.87 ± 0.05 mms
−1 and a relative contribution of 30%
for the HS sites. It should be noted, that the time dependent NFS-signal is due to
a coherent scattering process and therefore the shape of the signal is only sensitive