

4 From Small Molecules to Complex Systems: A Survey of Chemical …
193
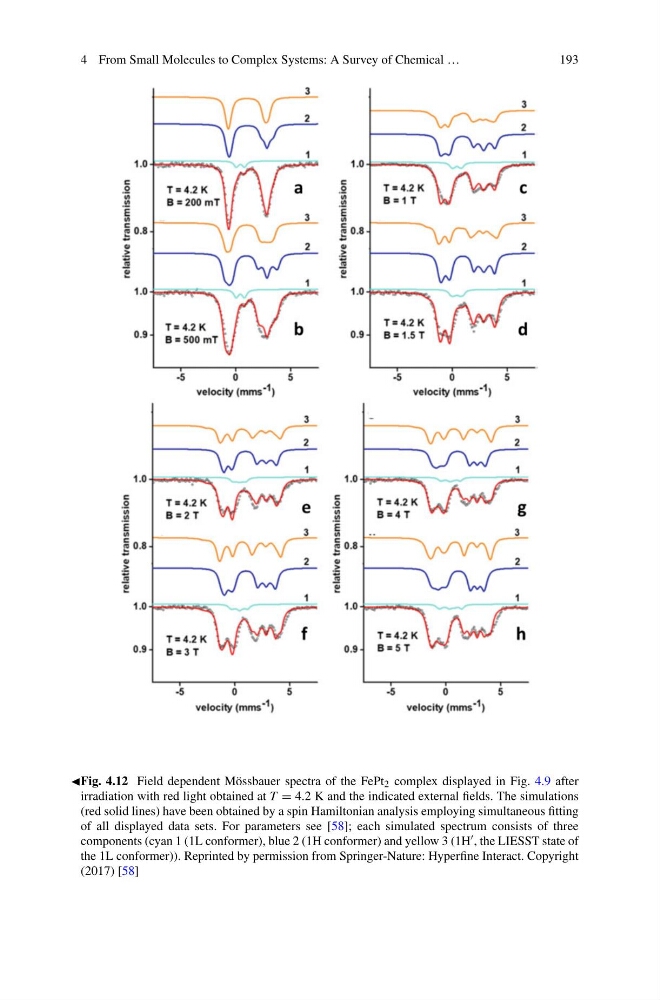
Fig. 4.12 Field dependent Mössbauer spectra of the FePt 2 complex displayed in Fig. 4.9 after
irradiation with red light obtained at T = 4.2 K and the indicated external fields. The simulations
(red solid lines) have been obtained by a spin Hamiltonian analysis employing simultaneous fitting
of all displayed data sets. For parameters see [58]; each simulated spectrum consists of three
components (cyan 1 (1L conformer), blue 2 (1H conformer) and yellow 3 (1H , the LIESST state of
the 1L conformer)). Reprinted by permission from Springer-Nature: Hyperfine Interact. Copyright
(2017) [58]
193
Fig. 4.12 Field dependent Mössbauer spectra of the FePt 2 complex displayed in Fig. 4.9 after
irradiation with red light obtained at T = 4.2 K and the indicated external fields. The simulations
(red solid lines) have been obtained by a spin Hamiltonian analysis employing simultaneous fitting
of all displayed data sets. For parameters see [58]; each simulated spectrum consists of three
components (cyan 1 (1L conformer), blue 2 (1H conformer) and yellow 3 (1H , the LIESST state of
the 1L conformer)). Reprinted by permission from Springer-Nature: Hyperfine Interact. Copyright
(2017) [58]