

134
R. Röhlsberger and J. Evers
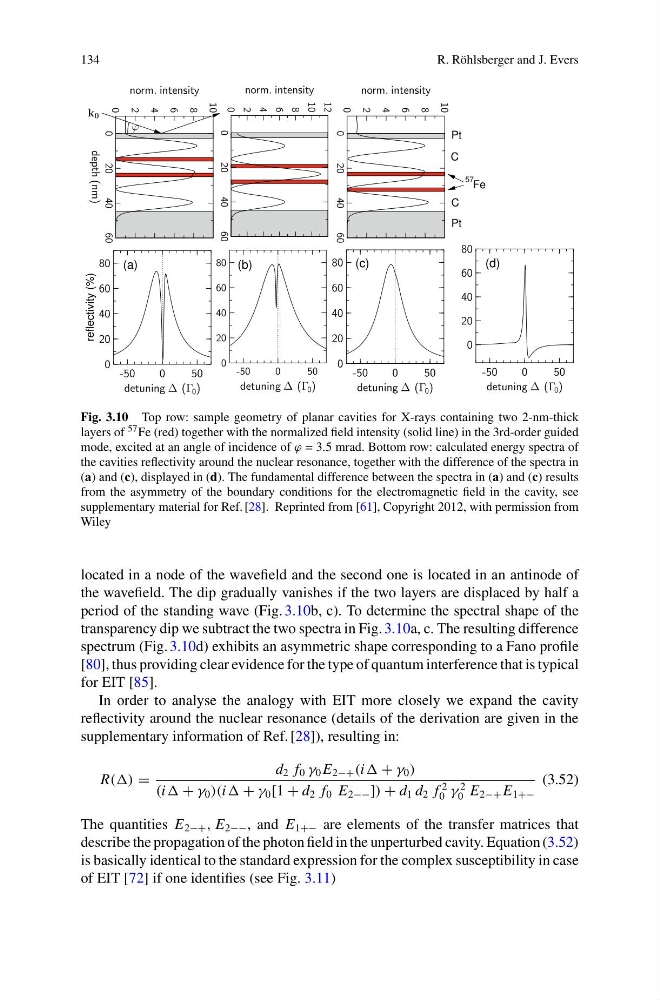
Fig. 3.10 Top row: sample geometry of planar cavities for X-rays containing two 2-nm-thick
layers of 57 Fe (red) together with the normalized field intensity (solid line) in the 3rd-order guided
mode, excited at an angle of incidence of ϕ = 3.5 mrad. Bottom row: calculated energy spectra of
the cavities reflectivity around the nuclear resonance, together with the difference of the spectra in
(a) and (c), displayed in (d). The fundamental difference between the spectra in (a) and (c) results
from the asymmetry of the boundary conditions for the electromagnetic field in the cavity, see
supplementary material for Ref. [28]. Reprinted from [61], Copyright 2012, with permission from
Wiley
located in a node of the wavefield and the second one is located in an antinode of
the wavefield. The dip gradually vanishes if the two layers are displaced by half a
period of the standing wave (Fig. 3.10b, c). To determine the spectral shape of the
transparency dip we subtract the two spectra in Fig. 3.10a, c. The resulting difference
spectrum (Fig. 3.10d) exhibits an asymmetric shape corresponding to a Fano profile
[80], thus providing clear evidence for the type of quantum interference that is typical
for EIT [85].
In order to analyse the analogy with EIT more closely we expand the cavity
reflectivity around the nuclear resonance (details of the derivation are given in the
supplementary information of Ref. [28]), resulting in:
R(() =
d 2 f 0 γ 0 E 2−+ (i + γ 0 )
(i + γ 0 )(i + γ 0 [1 + d 2 f 0 E 2−− ]) + d 1 d 2 f
2
0 γ
2
0 E 2−+ E 1+−
(3.52)
The quantities E 2−+ , E 2−− , and E 1+− are elements of the transfer matrices that
describe the propagation of the photon field in the unperturbed cavity. Equation (3.52)
is basically identical to the standard expression for the complex susceptibility in case
of EIT [72] if one identifies (see Fig. 3.11)
R. Röhlsberger and J. Evers
Fig. 3.10 Top row: sample geometry of planar cavities for X-rays containing two 2-nm-thick
layers of 57 Fe (red) together with the normalized field intensity (solid line) in the 3rd-order guided
mode, excited at an angle of incidence of ϕ = 3.5 mrad. Bottom row: calculated energy spectra of
the cavities reflectivity around the nuclear resonance, together with the difference of the spectra in
(a) and (c), displayed in (d). The fundamental difference between the spectra in (a) and (c) results
from the asymmetry of the boundary conditions for the electromagnetic field in the cavity, see
supplementary material for Ref. [28]. Reprinted from [61], Copyright 2012, with permission from
Wiley
located in a node of the wavefield and the second one is located in an antinode of
the wavefield. The dip gradually vanishes if the two layers are displaced by half a
period of the standing wave (Fig. 3.10b, c). To determine the spectral shape of the
transparency dip we subtract the two spectra in Fig. 3.10a, c. The resulting difference
spectrum (Fig. 3.10d) exhibits an asymmetric shape corresponding to a Fano profile
[80], thus providing clear evidence for the type of quantum interference that is typical
for EIT [85].
In order to analyse the analogy with EIT more closely we expand the cavity
reflectivity around the nuclear resonance (details of the derivation are given in the
supplementary information of Ref. [28]), resulting in:
R(() =
d 2 f 0 γ 0 E 2−+ (i + γ 0 )
(i + γ 0 )(i + γ 0 [1 + d 2 f 0 E 2−− ]) + d 1 d 2 f
2
0 γ
2
0 E 2−+ E 1+−
(3.52)
The quantities E 2−+ , E 2−− , and E 1+− are elements of the transfer matrices that
describe the propagation of the photon field in the unperturbed cavity. Equation (3.52)
is basically identical to the standard expression for the complex susceptibility in case
of EIT [72] if one identifies (see Fig. 3.11)