

492
Y. Yoshida
9.5.2 MSM Mappings and Complemental Techniques
Installed in Our Set-Up
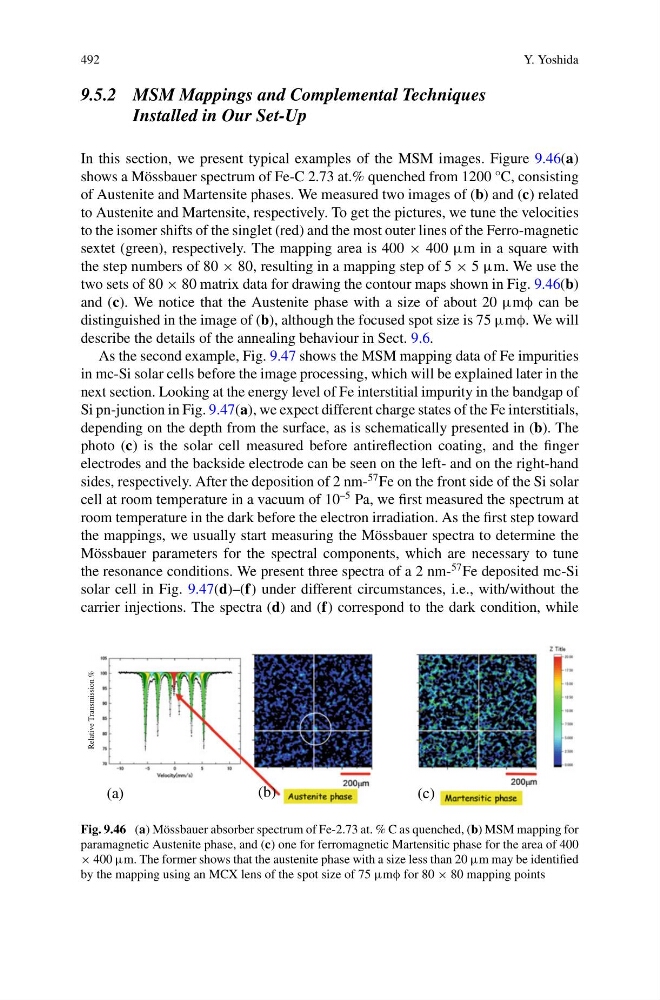
In this section, we present typical examples of the MSM images. Figure 9.46(a)
shows a Mössbauer spectrum of Fe-C 2.73 at.% quenched from 1200 °C, consisting
of Austenite and Martensite phases. We measured two images of (b) and (c) related
to Austenite and Martensite, respectively. To get the pictures, we tune the velocities
to the isomer shifts of the singlet (red) and the most outer lines of the Ferro-magnetic
sextet (green), respectively. The mapping area is 400 × 400 μm in a square with
the step numbers of 80 × 80, resulting in a mapping step of 5 × 5 μm. We use the
two sets of 80 × 80 matrix data for drawing the contour maps shown in Fig. 9.46(b)
and (c). We notice that the Austenite phase with a size of about 20 μmφ can be
distinguished in the image of (b), although the focused spot size is 75 μmφ. We will
describe the details of the annealing behaviour in Sect. 9.6.
As the second example, Fig. 9.47 shows the MSM mapping data of Fe impurities
in mc-Si solar cells before the image processing, which will be explained later in the
next section. Looking at the energy level of Fe interstitial impurity in the bandgap of
Si pn-junction in Fig. 9.47(a), we expect different charge states of the Fe interstitials,
depending on the depth from the surface, as is schematically presented in (b). The
photo (c) is the solar cell measured before antireflection coating, and the finger
electrodes and the backside electrode can be seen on the left- and on the right-hand
sides, respectively. After the deposition of 2 nm57 Fe on the front side of the Si solar
cell at room temperature in a vacuum of 10
–5 Pa, we first measured the spectrum at
room temperature in the dark before the electron irradiation. As the first step toward
the mappings, we usually start measuring the Mössbauer spectra to determine the
Mössbauer parameters for the spectral components, which are necessary to tune
the resonance conditions. We present three spectra of a 2 nm57 Fe deposited mc-Si
solar cell in Fig. 9.47(d)–(f) under different circumstances, i.e., with/without the
carrier injections. The spectra (d) and (f) correspond to the dark condition, while
(a)
(b)
(c)
Relative Transmission %
Fig. 9.46 (a) Mössbauer absorber spectrum of Fe-2.73 at. % C as quenched, (b) MSM mapping for
paramagnetic Austenite phase, and (c) one for ferromagnetic Martensitic phase for the area of 400
× 400 μm. The former shows that the austenite phase with a size less than 20 μm may be identified
by the mapping using an MCX lens of the spot size of 75 μmφ for 80 × 80 mapping points
Y. Yoshida
9.5.2 MSM Mappings and Complemental Techniques
Installed in Our Set-Up
In this section, we present typical examples of the MSM images. Figure 9.46(a)
shows a Mössbauer spectrum of Fe-C 2.73 at.% quenched from 1200 °C, consisting
of Austenite and Martensite phases. We measured two images of (b) and (c) related
to Austenite and Martensite, respectively. To get the pictures, we tune the velocities
to the isomer shifts of the singlet (red) and the most outer lines of the Ferro-magnetic
sextet (green), respectively. The mapping area is 400 × 400 μm in a square with
the step numbers of 80 × 80, resulting in a mapping step of 5 × 5 μm. We use the
two sets of 80 × 80 matrix data for drawing the contour maps shown in Fig. 9.46(b)
and (c). We notice that the Austenite phase with a size of about 20 μmφ can be
distinguished in the image of (b), although the focused spot size is 75 μmφ. We will
describe the details of the annealing behaviour in Sect. 9.6.
As the second example, Fig. 9.47 shows the MSM mapping data of Fe impurities
in mc-Si solar cells before the image processing, which will be explained later in the
next section. Looking at the energy level of Fe interstitial impurity in the bandgap of
Si pn-junction in Fig. 9.47(a), we expect different charge states of the Fe interstitials,
depending on the depth from the surface, as is schematically presented in (b). The
photo (c) is the solar cell measured before antireflection coating, and the finger
electrodes and the backside electrode can be seen on the left- and on the right-hand
sides, respectively. After the deposition of 2 nm57 Fe on the front side of the Si solar
cell at room temperature in a vacuum of 10
–5 Pa, we first measured the spectrum at
room temperature in the dark before the electron irradiation. As the first step toward
the mappings, we usually start measuring the Mössbauer spectra to determine the
Mössbauer parameters for the spectral components, which are necessary to tune
the resonance conditions. We present three spectra of a 2 nm57 Fe deposited mc-Si
solar cell in Fig. 9.47(d)–(f) under different circumstances, i.e., with/without the
carrier injections. The spectra (d) and (f) correspond to the dark condition, while
(a)
(b)
(c)
Relative Transmission %
Fig. 9.46 (a) Mössbauer absorber spectrum of Fe-2.73 at. % C as quenched, (b) MSM mapping for
paramagnetic Austenite phase, and (c) one for ferromagnetic Martensitic phase for the area of 400
× 400 μm. The former shows that the austenite phase with a size less than 20 μm may be identified
by the mapping using an MCX lens of the spot size of 75 μmφ for 80 × 80 mapping points