

368
P.-E. Lippens
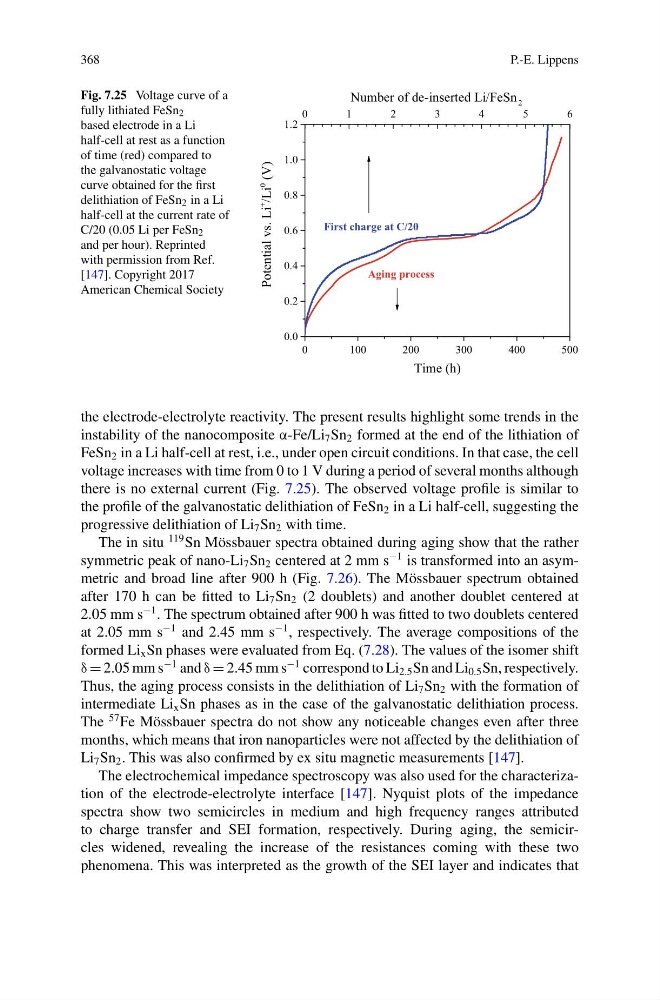
Fig. 7.25 Voltage curve of a
fully lithiated FeSn 2
based electrode in a Li
half-cell at rest as a function
of time (red) compared to
the galvanostatic voltage
curve obtained for the first
delithiation of FeSn 2 in a Li
half-cell at the current rate of
C/20 (0.05 Li per FeSn 2
and per hour). Reprinted
with permission from Ref.
[147]. Copyright 2017
American Chemical Society
0
100
200
300
400
500
0.0
0.2
0.4
0.6
0.8
1.0
1.2
Potential vs. Li
+
/Li
0
(V)
Time (h)
0
1
2
3
4
5
6
Number of de-inserted Li/FeSn 2
Aging process
First charge at C/20
the electrode-electrolyte reactivity. The present results highlight some trends in the
instability of the nanocomposite α-Fe/Li 7 Sn 2 formed at the end of the lithiation of
FeSn 2 in a Li half-cell at rest, i.e., under open circuit conditions. In that case, the cell
voltage increases with time from 0 to 1 V during a period of several months although
there is no external current (Fig. 7.25). The observed voltage profile is similar to
the profile of the galvanostatic delithiation of FeSn 2 in a Li half-cell, suggesting the
progressive delithiation of Li 7 Sn 2 with time.
The in situ
119 Sn Mössbauer spectra obtained during aging show that the rather
symmetric peak of nano-Li 7 Sn 2 centered at 2 mm s
−1 is transformed into an asymmetric and broad line after 900 h (Fig. 7.26). The Mössbauer spectrum obtained
after 170 h can be fitted to Li 7 Sn 2 (2 doublets) and another doublet centered at
2.05 mm s
−1 . The spectrum obtained after 900 h was fitted to two doublets centered
at 2.05 mm s
−1 and 2.45 mm s
−1 , respectively. The average compositions of the
formed Li x Sn phases were evaluated from Eq. (7.28). The values of the isomer shift
δ = 2.05 mm s
−1 and δ = 2.45 mm s
−1 correspond to Li 2.5 Sn and Li 0.5 Sn, respectively.
Thus, the aging process consists in the delithiation of Li 7 Sn 2 with the formation of
intermediate Li x Sn phases as in the case of the galvanostatic delithiation process.
The
57 Fe Mössbauer spectra do not show any noticeable changes even after three
months, which means that iron nanoparticles were not affected by the delithiation of
Li 7 Sn 2 . This was also confirmed by ex situ magnetic measurements [147].
The electrochemical impedance spectroscopy was also used for the characterization of the electrode-electrolyte interface [147]. Nyquist plots of the impedance
spectra show two semicircles in medium and high frequency ranges attributed
to charge transfer and SEI formation, respectively. During aging, the semicircles widened, revealing the increase of the resistances coming with these two
phenomena. This was interpreted as the growth of the SEI layer and indicates that
P.-E. Lippens
Fig. 7.25 Voltage curve of a
fully lithiated FeSn 2
based electrode in a Li
half-cell at rest as a function
of time (red) compared to
the galvanostatic voltage
curve obtained for the first
delithiation of FeSn 2 in a Li
half-cell at the current rate of
C/20 (0.05 Li per FeSn 2
and per hour). Reprinted
with permission from Ref.
[147]. Copyright 2017
American Chemical Society
0
100
200
300
400
500
0.0
0.2
0.4
0.6
0.8
1.0
1.2
Potential vs. Li
+
/Li
0
(V)
Time (h)
0
1
2
3
4
5
6
Number of de-inserted Li/FeSn 2
Aging process
First charge at C/20
the electrode-electrolyte reactivity. The present results highlight some trends in the
instability of the nanocomposite α-Fe/Li 7 Sn 2 formed at the end of the lithiation of
FeSn 2 in a Li half-cell at rest, i.e., under open circuit conditions. In that case, the cell
voltage increases with time from 0 to 1 V during a period of several months although
there is no external current (Fig. 7.25). The observed voltage profile is similar to
the profile of the galvanostatic delithiation of FeSn 2 in a Li half-cell, suggesting the
progressive delithiation of Li 7 Sn 2 with time.
The in situ
119 Sn Mössbauer spectra obtained during aging show that the rather
symmetric peak of nano-Li 7 Sn 2 centered at 2 mm s
−1 is transformed into an asymmetric and broad line after 900 h (Fig. 7.26). The Mössbauer spectrum obtained
after 170 h can be fitted to Li 7 Sn 2 (2 doublets) and another doublet centered at
2.05 mm s
−1 . The spectrum obtained after 900 h was fitted to two doublets centered
at 2.05 mm s
−1 and 2.45 mm s
−1 , respectively. The average compositions of the
formed Li x Sn phases were evaluated from Eq. (7.28). The values of the isomer shift
δ = 2.05 mm s
−1 and δ = 2.45 mm s
−1 correspond to Li 2.5 Sn and Li 0.5 Sn, respectively.
Thus, the aging process consists in the delithiation of Li 7 Sn 2 with the formation of
intermediate Li x Sn phases as in the case of the galvanostatic delithiation process.
The
57 Fe Mössbauer spectra do not show any noticeable changes even after three
months, which means that iron nanoparticles were not affected by the delithiation of
Li 7 Sn 2 . This was also confirmed by ex situ magnetic measurements [147].
The electrochemical impedance spectroscopy was also used for the characterization of the electrode-electrolyte interface [147]. Nyquist plots of the impedance
spectra show two semicircles in medium and high frequency ranges attributed
to charge transfer and SEI formation, respectively. During aging, the semicircles widened, revealing the increase of the resistances coming with these two
phenomena. This was interpreted as the growth of the SEI layer and indicates that