

7 Application of Mössbauer Spectroscopy to Li-Ion and Na-Ion …
361
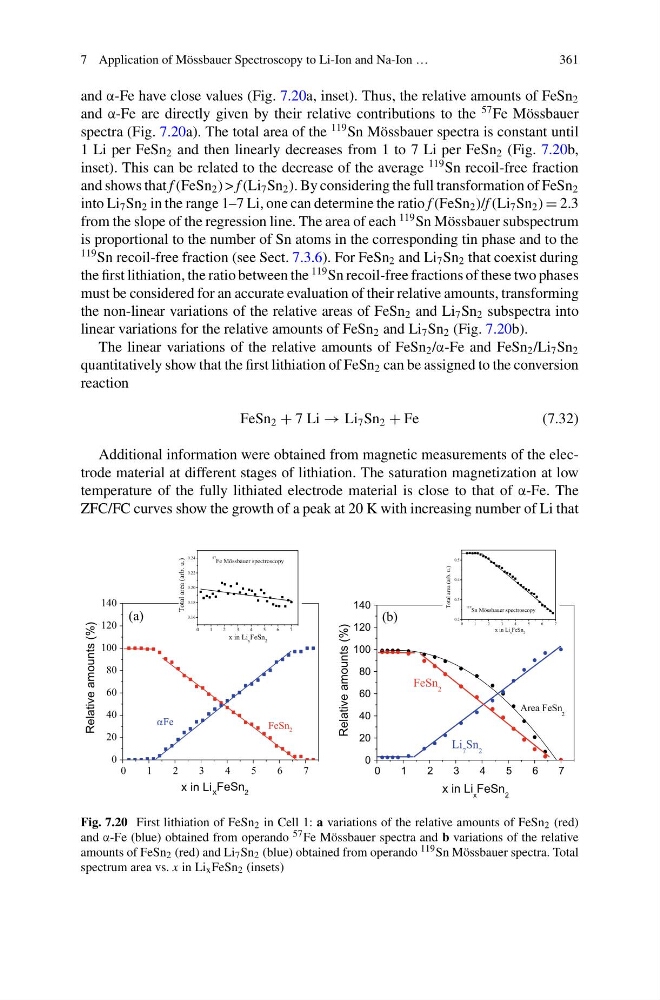
and α-Fe have close values (Fig. 7.20a, inset). Thus, the relative amounts of FeSn 2
and α-Fe are directly given by their relative contributions to the
57 Fe Mössbauer
spectra (Fig. 7.20a). The total area of the
119 Sn Mössbauer spectra is constant until
1 Li per FeSn 2 and then linearly decreases from 1 to 7 Li per FeSn 2 (Fig. 7.20b,
inset). This can be related to the decrease of the average
119 Sn recoil-free fraction
and shows that f (FeSn 2 ) > f (Li 7 Sn 2 ). By considering the full transformation of FeSn 2
into Li 7 Sn 2 in the range 1–7 Li, one can determine the ratio f (FeSn 2 )/f (Li 7 Sn 2 ) = 2.3
from the slope of the regression line. The area of each
119 Sn Mössbauer subspectrum
is proportional to the number of Sn atoms in the corresponding tin phase and to the
119 Sn recoil-free fraction (see Sect. 7.3.6). For FeSn 2 and Li 7 Sn 2 that coexist during
the first lithiation, the ratio between the
119 Sn recoil-free fractions of these two phases
must be considered for an accurate evaluation of their relative amounts, transforming
the non-linear variations of the relative areas of FeSn 2 and Li 7 Sn 2 subspectra into
linear variations for the relative amounts of FeSn 2 and Li 7 Sn 2 (Fig. 7.20b).
The linear variations of the relative amounts of FeSn 2 /α-Fe and FeSn 2 /Li 7 Sn 2
quantitatively show that the first lithiation of FeSn 2 can be assigned to the conversion
reaction
FeSn 2 + 7 Li → Li 7 Sn 2 + Fe
(7.32)
Additional information were obtained from magnetic measurements of the electrode material at different stages of lithiation. The saturation magnetization at low
temperature of the fully lithiated electrode material is close to that of α-Fe. The
ZFC/FC curves show the growth of a peak at 20 K with increasing number of Li that
0
20
40
60
80
100
120
140
αFe
x in Li x FeSn 2
Relative amounts (%)
FeSn 2
(a)
0
1
2
3
4
5
6
7
0
1
2
3
4
5
6
7
0
20
40
60
80
100
120
140
Li 7 Sn 2
FeSn 2
Area FeSn
2
Relative amounts (%)
x in Li x FeSn 2
(b)
0
1
2
3
4
5
6
7
0.16
0.18
0.20
0.22
0.24
x in Li x FeSn 2
57
Fe Mössbauer spectroscopy
0
1
2
3
4
5
6
7
0.2
0.3
0.4
0.5
x in Li x FeSn 2
Total area (arb. u.)
119
Sn Mössbauer spectroscopy
Total area (arb.
u.)
Fig. 7.20 First lithiation of FeSn 2 in Cell 1: a variations of the relative amounts of FeSn 2 (red)
and α-Fe (blue) obtained from operando 57 Fe Mössbauer spectra and b variations of the relative
amounts of FeSn 2 (red) and Li 7 Sn 2 (blue) obtained from operando 119 Sn Mössbauer spectra. Total
spectrum area vs. x in Li x FeSn 2 (insets)
361
and α-Fe have close values (Fig. 7.20a, inset). Thus, the relative amounts of FeSn 2
and α-Fe are directly given by their relative contributions to the
57 Fe Mössbauer
spectra (Fig. 7.20a). The total area of the
119 Sn Mössbauer spectra is constant until
1 Li per FeSn 2 and then linearly decreases from 1 to 7 Li per FeSn 2 (Fig. 7.20b,
inset). This can be related to the decrease of the average
119 Sn recoil-free fraction
and shows that f (FeSn 2 ) > f (Li 7 Sn 2 ). By considering the full transformation of FeSn 2
into Li 7 Sn 2 in the range 1–7 Li, one can determine the ratio f (FeSn 2 )/f (Li 7 Sn 2 ) = 2.3
from the slope of the regression line. The area of each
119 Sn Mössbauer subspectrum
is proportional to the number of Sn atoms in the corresponding tin phase and to the
119 Sn recoil-free fraction (see Sect. 7.3.6). For FeSn 2 and Li 7 Sn 2 that coexist during
the first lithiation, the ratio between the
119 Sn recoil-free fractions of these two phases
must be considered for an accurate evaluation of their relative amounts, transforming
the non-linear variations of the relative areas of FeSn 2 and Li 7 Sn 2 subspectra into
linear variations for the relative amounts of FeSn 2 and Li 7 Sn 2 (Fig. 7.20b).
The linear variations of the relative amounts of FeSn 2 /α-Fe and FeSn 2 /Li 7 Sn 2
quantitatively show that the first lithiation of FeSn 2 can be assigned to the conversion
reaction
FeSn 2 + 7 Li → Li 7 Sn 2 + Fe
(7.32)
Additional information were obtained from magnetic measurements of the electrode material at different stages of lithiation. The saturation magnetization at low
temperature of the fully lithiated electrode material is close to that of α-Fe. The
ZFC/FC curves show the growth of a peak at 20 K with increasing number of Li that
0
20
40
60
80
100
120
140
αFe
x in Li x FeSn 2
Relative amounts (%)
FeSn 2
(a)
0
1
2
3
4
5
6
7
0
1
2
3
4
5
6
7
0
20
40
60
80
100
120
140
Li 7 Sn 2
FeSn 2
Area FeSn
2
Relative amounts (%)
x in Li x FeSn 2
(b)
0
1
2
3
4
5
6
7
0.16
0.18
0.20
0.22
0.24
x in Li x FeSn 2
57
Fe Mössbauer spectroscopy
0
1
2
3
4
5
6
7
0.2
0.3
0.4
0.5
x in Li x FeSn 2
Total area (arb. u.)
119
Sn Mössbauer spectroscopy
Total area (arb.
u.)
Fig. 7.20 First lithiation of FeSn 2 in Cell 1: a variations of the relative amounts of FeSn 2 (red)
and α-Fe (blue) obtained from operando 57 Fe Mössbauer spectra and b variations of the relative
amounts of FeSn 2 (red) and Li 7 Sn 2 (blue) obtained from operando 119 Sn Mössbauer spectra. Total
spectrum area vs. x in Li x FeSn 2 (insets)