

7 Application of Mössbauer Spectroscopy to Li-Ion and Na-Ion …
349
are 3580 mA h g
−1 (Si) and 990 mA h g
−1 (βSn) [89]. These values are significantly
higher than the theoretical values of ∼800 mA h cm
−3 and 372 mA h g
−1 for graphite
that accommodates only 1 Li per 6 C.
However, there is a crucial issue with alloying reactions. In contrast to Li intercalation between graphite layers that leads to about 10% volume changes, alloying
reactions suffer from strong volume variations of about 300% for Si/Li 3.75 Si and
Sn/Li 4.4 Sn transformations. This causes mechanical (electrode film cracks), electrical
(loss of electrical contacts) and chemical (SEI instabilities) degradations, reducing
significantly the cycling performance of electrodes. Different approaches have been
proposed to overcome this problem by improving the electrode formulation (binder,
conductive additives), the electrolyte, or the electrochemically active materials. In
the latter case, this includes particle size reduction (nanoparticles), particle coating,
dispersion of the active particles within the pristine material (composite), and in situ
dispersion of the active species during the first electrochemical cycles. The electrochemical reactions taking place in these systems are rather complex and some examples of the application of Mössbauer spectroscopy to elucidate such mechanisms are
given in Sect. 7.6.
The present section deals with Li-Sn and Na-Sn alloying reactions. Although
Si is not a Mössbauer element, previous investigations of Si x Sn amorphous phases
successfully provided information on Li-Si alloying reactions as shown in Sect. 7.5.4.
7.5.2 βSn as Negative Electrode Material for Li-Ion Batteries
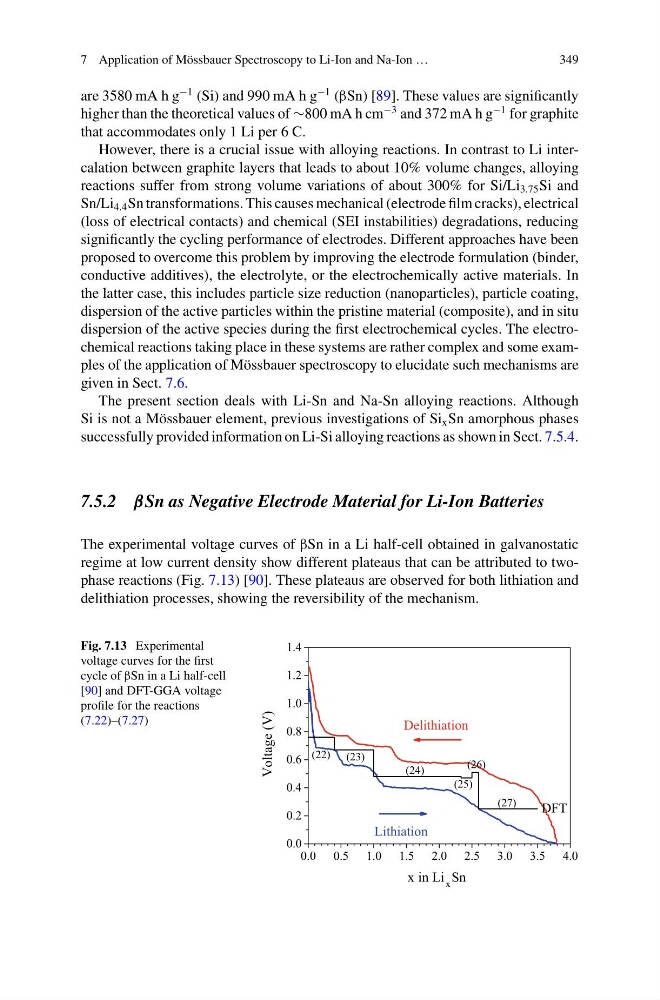
The experimental voltage curves of βSn in a Li half-cell obtained in galvanostatic
regime at low current density show different plateaus that can be attributed to twophase reactions (Fig. 7.13) [90]. These plateaus are observed for both lithiation and
delithiation processes, showing the reversibility of the mechanism.
Fig. 7.13 Experimental
voltage curves for the first
cycle of βSn in a Li half-cell
[90] and DFT-GGA voltage
profile for the reactions
(7.22)–(7.27)
0.0 0.5 1.0 1.5 2.0 2.5 3.0 3.5 4.0
0.0
0.2
0.4
0.6
0.8
1.0
1.2
1.4
(27)
(26)
(25)
(24)
(22)
DFT
Lithiation
Delithiation
Voltage (V)
x in Li x Sn
(23)
349
are 3580 mA h g
−1 (Si) and 990 mA h g
−1 (βSn) [89]. These values are significantly
higher than the theoretical values of ∼800 mA h cm
−3 and 372 mA h g
−1 for graphite
that accommodates only 1 Li per 6 C.
However, there is a crucial issue with alloying reactions. In contrast to Li intercalation between graphite layers that leads to about 10% volume changes, alloying
reactions suffer from strong volume variations of about 300% for Si/Li 3.75 Si and
Sn/Li 4.4 Sn transformations. This causes mechanical (electrode film cracks), electrical
(loss of electrical contacts) and chemical (SEI instabilities) degradations, reducing
significantly the cycling performance of electrodes. Different approaches have been
proposed to overcome this problem by improving the electrode formulation (binder,
conductive additives), the electrolyte, or the electrochemically active materials. In
the latter case, this includes particle size reduction (nanoparticles), particle coating,
dispersion of the active particles within the pristine material (composite), and in situ
dispersion of the active species during the first electrochemical cycles. The electrochemical reactions taking place in these systems are rather complex and some examples of the application of Mössbauer spectroscopy to elucidate such mechanisms are
given in Sect. 7.6.
The present section deals with Li-Sn and Na-Sn alloying reactions. Although
Si is not a Mössbauer element, previous investigations of Si x Sn amorphous phases
successfully provided information on Li-Si alloying reactions as shown in Sect. 7.5.4.
7.5.2 βSn as Negative Electrode Material for Li-Ion Batteries
The experimental voltage curves of βSn in a Li half-cell obtained in galvanostatic
regime at low current density show different plateaus that can be attributed to twophase reactions (Fig. 7.13) [90]. These plateaus are observed for both lithiation and
delithiation processes, showing the reversibility of the mechanism.
Fig. 7.13 Experimental
voltage curves for the first
cycle of βSn in a Li half-cell
[90] and DFT-GGA voltage
profile for the reactions
(7.22)–(7.27)
0.0 0.5 1.0 1.5 2.0 2.5 3.0 3.5 4.0
0.0
0.2
0.4
0.6
0.8
1.0
1.2
1.4
(27)
(26)
(25)
(24)
(22)
DFT
Lithiation
Delithiation
Voltage (V)
x in Li x Sn
(23)