

244
C. McCammon
5.5.2 Mapping on a Microscopic Scale
Geographic information system (GIS) software is most commonly applied at the
kilometre scale (cities and continents), but the GIS approach can also be used at the
microscale [49]. Like most analytical methods, Mössbauer spectroscopy provides
information that is most useful when combined with results from other techniques,
for example structure determination or chemical analysis. Curating all information
collected on a material is straightforward for homogeneous samples, but becomes
more complicated for inhomogeneous samples because spatial relationships are
important.
The free and open source software package QGIS (https://qgis.org/) provides
a means to integrate all collected information and display visual maps through a
user-friendly GUI. The Wisconsin Secondary Ion Mass Spectrometer Laboratory
has developed a knowledge base that includes a tutorial on applying QGIS software
to the integration of analytical data with spatial information (e.g., analysis locations, regions of interest or pictures) (https://sites.google.com/a/wisc.edu/wiscsimsmicro-qgis/home). To illustrate its application to inhomogeneous samples, QGIS was
applied to data measured on metasomatised eclogite from the same locality as the
sample shown in Fig. 5.11k.
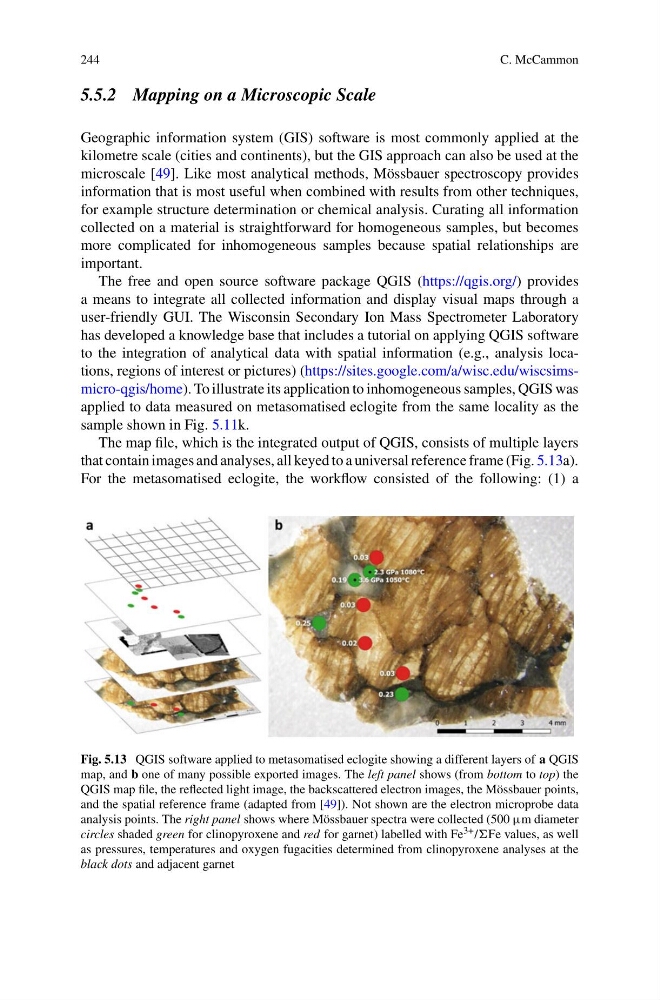
The map file, which is the integrated output of QGIS, consists of multiple layers
that contain images and analyses, all keyed to a universal reference frame (Fig. 5.13a).
For the metasomatised eclogite, the workflow consisted of the following: (1) a
Fig. 5.13 QGIS software applied to metasomatised eclogite showing a different layers of a QGIS
map, and b one of many possible exported images. The left panel shows (from bottom to top) the
QGIS map file, the reflected light image, the backscattered electron images, the Mössbauer points,
and the spatial reference frame (adapted from [49]). Not shown are the electron microprobe data
analysis points. The right panel shows where Mössbauer spectra were collected (500 μm diameter
circles shaded green for clinopyroxene and red for garnet) labelled with Fe 3+ /Fe values, as well
as pressures, temperatures and oxygen fugacities determined from clinopyroxene analyses at the
black dots and adjacent garnet
C. McCammon
5.5.2 Mapping on a Microscopic Scale
Geographic information system (GIS) software is most commonly applied at the
kilometre scale (cities and continents), but the GIS approach can also be used at the
microscale [49]. Like most analytical methods, Mössbauer spectroscopy provides
information that is most useful when combined with results from other techniques,
for example structure determination or chemical analysis. Curating all information
collected on a material is straightforward for homogeneous samples, but becomes
more complicated for inhomogeneous samples because spatial relationships are
important.
The free and open source software package QGIS (https://qgis.org/) provides
a means to integrate all collected information and display visual maps through a
user-friendly GUI. The Wisconsin Secondary Ion Mass Spectrometer Laboratory
has developed a knowledge base that includes a tutorial on applying QGIS software
to the integration of analytical data with spatial information (e.g., analysis locations, regions of interest or pictures) (https://sites.google.com/a/wisc.edu/wiscsimsmicro-qgis/home). To illustrate its application to inhomogeneous samples, QGIS was
applied to data measured on metasomatised eclogite from the same locality as the
sample shown in Fig. 5.11k.
The map file, which is the integrated output of QGIS, consists of multiple layers
that contain images and analyses, all keyed to a universal reference frame (Fig. 5.13a).
For the metasomatised eclogite, the workflow consisted of the following: (1) a
Fig. 5.13 QGIS software applied to metasomatised eclogite showing a different layers of a QGIS
map, and b one of many possible exported images. The left panel shows (from bottom to top) the
QGIS map file, the reflected light image, the backscattered electron images, the Mössbauer points,
and the spatial reference frame (adapted from [49]). Not shown are the electron microprobe data
analysis points. The right panel shows where Mössbauer spectra were collected (500 μm diameter
circles shaded green for clinopyroxene and red for garnet) labelled with Fe 3+ /Fe values, as well
as pressures, temperatures and oxygen fugacities determined from clinopyroxene analyses at the
black dots and adjacent garnet