

240
C. McCammon
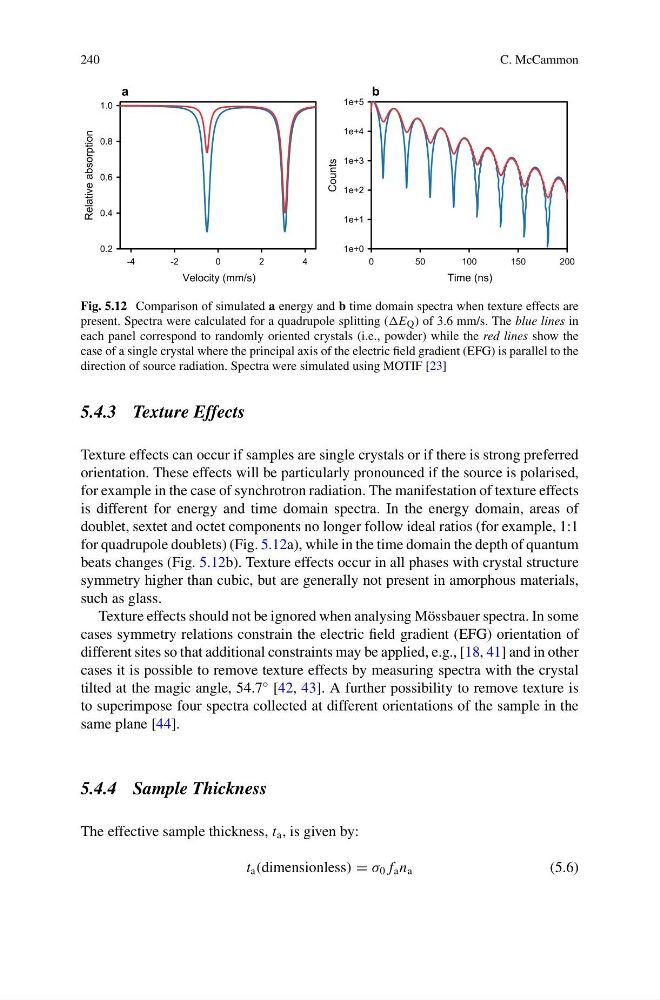
Fig. 5.12 Comparison of simulated a energy and b time domain spectra when texture effects are
present. Spectra were calculated for a quadrupole splitting ( Q ) of 3.6 mm/s. The blue lines in
each panel correspond to randomly oriented crystals (i.e., powder) while the red lines show the
case of a single crystal where the principal axis of the electric field gradient (EFG) is parallel to the
direction of source radiation. Spectra were simulated using MOTIF [23]
5.4.3 Texture Effects
Texture effects can occur if samples are single crystals or if there is strong preferred
orientation. These effects will be particularly pronounced if the source is polarised,
for example in the case of synchrotron radiation. The manifestation of texture effects
is different for energy and time domain spectra. In the energy domain, areas of
doublet, sextet and octet components no longer follow ideal ratios (for example, 1:1
for quadrupole doublets) (Fig. 5.12a), while in the time domain the depth of quantum
beats changes (Fig. 5.12b). Texture effects occur in all phases with crystal structure
symmetry higher than cubic, but are generally not present in amorphous materials,
such as glass.
Texture effects should not be ignored when analysing Mössbauer spectra. In some
cases symmetry relations constrain the electric field gradient (EFG) orientation of
different sites so that additional constraints may be applied, e.g., [18, 41] and in other
cases it is possible to remove texture effects by measuring spectra with the crystal
tilted at the magic angle, 54.7° [42, 43]. A further possibility to remove texture is
to superimpose four spectra collected at different orientations of the sample in the
same plane [44].
5.4.4 Sample Thickness
The effective sample thickness, t a , is given by:
t a (dimensionless) = σ 0 f a n a
(5.6)
C. McCammon
Fig. 5.12 Comparison of simulated a energy and b time domain spectra when texture effects are
present. Spectra were calculated for a quadrupole splitting ( Q ) of 3.6 mm/s. The blue lines in
each panel correspond to randomly oriented crystals (i.e., powder) while the red lines show the
case of a single crystal where the principal axis of the electric field gradient (EFG) is parallel to the
direction of source radiation. Spectra were simulated using MOTIF [23]
5.4.3 Texture Effects
Texture effects can occur if samples are single crystals or if there is strong preferred
orientation. These effects will be particularly pronounced if the source is polarised,
for example in the case of synchrotron radiation. The manifestation of texture effects
is different for energy and time domain spectra. In the energy domain, areas of
doublet, sextet and octet components no longer follow ideal ratios (for example, 1:1
for quadrupole doublets) (Fig. 5.12a), while in the time domain the depth of quantum
beats changes (Fig. 5.12b). Texture effects occur in all phases with crystal structure
symmetry higher than cubic, but are generally not present in amorphous materials,
such as glass.
Texture effects should not be ignored when analysing Mössbauer spectra. In some
cases symmetry relations constrain the electric field gradient (EFG) orientation of
different sites so that additional constraints may be applied, e.g., [18, 41] and in other
cases it is possible to remove texture effects by measuring spectra with the crystal
tilted at the magic angle, 54.7° [42, 43]. A further possibility to remove texture is
to superimpose four spectra collected at different orientations of the sample in the
same plane [44].
5.4.4 Sample Thickness
The effective sample thickness, t a , is given by:
t a (dimensionless) = σ 0 f a n a
(5.6)