

4 From Small Molecules to Complex Systems: A Survey of Chemical …
199
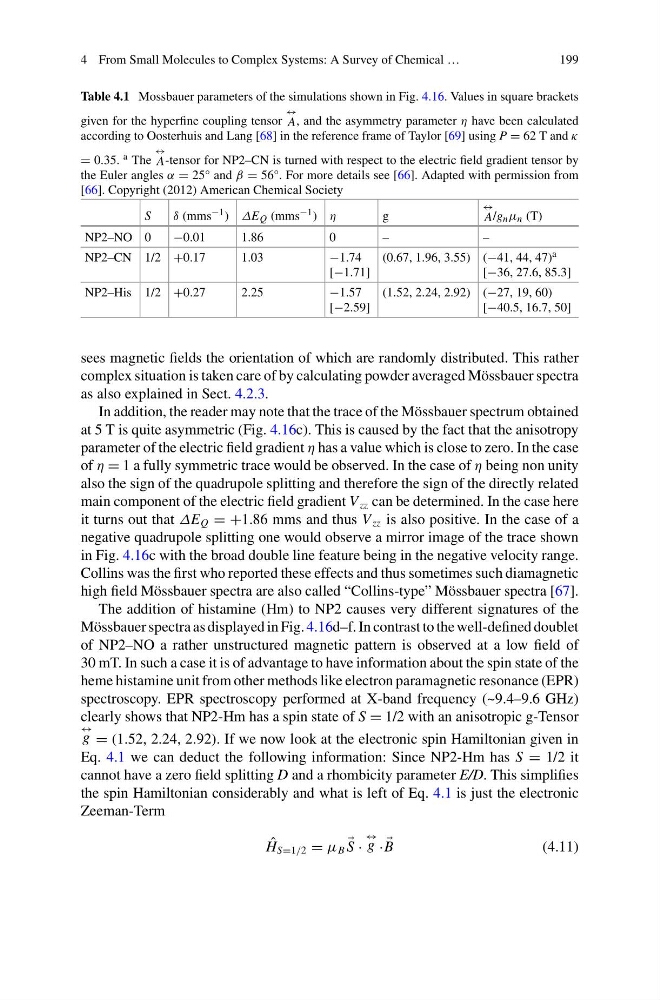
Table 4.1 Mossbauer parameters of the simulations shown in Fig. 4.16. Values in square brackets
given for the hyperfine coupling tensor
↔
A, and the asymmetry parameter η have been calculated
according to Oosterhuis and Lang [68] in the reference frame of Taylor [69] using P = 62 T and κ
= 0.35. a The
↔
A-tensor for NP2–CN is turned with respect to the electric field gradient tensor by
the Euler angles α = 25° and β = 56°. For more details see [66]. Adapted with permission from
[66]. Copyright (2012) American Chemical Society
S
δ (mms −1 ) ΔE Q (mms −1 ) η
g
↔
A/gnμn (T)
NP2–NO 0
−0.01
1.86
0
–
–
NP2–CN 1/2 +0.17
1.03
−1.74
[−1.71]
(0.67, 1.96, 3.55) (−41, 44, 47) a
[−36, 27.6, 85.3]
NP2–His 1/2 +0.27
2.25
−1.57
[−2.59]
(1.52, 2.24, 2.92) (−27, 19, 60)
[−40.5, 16.7, 50]
sees magnetic fields the orientation of which are randomly distributed. This rather
complex situation is taken care of by calculating powder averaged Mössbauer spectra
as also explained in Sect. 4.2.3.
In addition, the reader may note that the trace of the Mössbauer spectrum obtained
at 5 T is quite asymmetric (Fig. 4.16c). This is caused by the fact that the anisotropy
parameter of the electric field gradient η has a value which is close to zero. In the case
of η = 1 a fully symmetric trace would be observed. In the case of η being non unity
also the sign of the quadrupole splitting and therefore the sign of the directly related
main component of the electric field gradient V zz can be determined. In the case here
it turns out that ΔE Q = +1.86 mms and thus V zz is also positive. In the case of a
negative quadrupole splitting one would observe a mirror image of the trace shown
in Fig. 4.16c with the broad double line feature being in the negative velocity range.
Collins was the first who reported these effects and thus sometimes such diamagnetic
high field Mössbauer spectra are also called “Collins-type” Mössbauer spectra [67].
The addition of histamine (Hm) to NP2 causes very different signatures of the
Mössbauer spectra as displayed in Fig. 4.16d–f. In contrast to the well-defined doublet
of NP2–NO a rather unstructured magnetic pattern is observed at a low field of
30 mT. In such a case it is of advantage to have information about the spin state of the
heme histamine unit from other methods like electron paramagnetic resonance (EPR)
spectroscopy. EPR spectroscopy performed at X-band frequency (~9.4–9.6 GHz)
clearly shows that NP2-Hm has a spin state of S = 1/2 with an anisotropic g-Tensor
↔
g = (1.52, 2.24, 2.92). If we now look at the electronic spin Hamiltonian given in
Eq. 4.1 we can deduct the following information: Since NP2-Hm has S = 1/2 it
cannot have a zero field splitting D and a rhombicity parameter E/D. This simplifies
the spin Hamiltonian considerably and what is left of Eq. 4.1 is just the electronic
Zeeman-Term
ˆ
H S=1/2 = μ B
S ·
↔
g ·
B
(4.11)
199
Table 4.1 Mossbauer parameters of the simulations shown in Fig. 4.16. Values in square brackets
given for the hyperfine coupling tensor
↔
A, and the asymmetry parameter η have been calculated
according to Oosterhuis and Lang [68] in the reference frame of Taylor [69] using P = 62 T and κ
= 0.35. a The
↔
A-tensor for NP2–CN is turned with respect to the electric field gradient tensor by
the Euler angles α = 25° and β = 56°. For more details see [66]. Adapted with permission from
[66]. Copyright (2012) American Chemical Society
S
δ (mms −1 ) ΔE Q (mms −1 ) η
g
↔
A/gnμn (T)
NP2–NO 0
−0.01
1.86
0
–
–
NP2–CN 1/2 +0.17
1.03
−1.74
[−1.71]
(0.67, 1.96, 3.55) (−41, 44, 47) a
[−36, 27.6, 85.3]
NP2–His 1/2 +0.27
2.25
−1.57
[−2.59]
(1.52, 2.24, 2.92) (−27, 19, 60)
[−40.5, 16.7, 50]
sees magnetic fields the orientation of which are randomly distributed. This rather
complex situation is taken care of by calculating powder averaged Mössbauer spectra
as also explained in Sect. 4.2.3.
In addition, the reader may note that the trace of the Mössbauer spectrum obtained
at 5 T is quite asymmetric (Fig. 4.16c). This is caused by the fact that the anisotropy
parameter of the electric field gradient η has a value which is close to zero. In the case
of η = 1 a fully symmetric trace would be observed. In the case of η being non unity
also the sign of the quadrupole splitting and therefore the sign of the directly related
main component of the electric field gradient V zz can be determined. In the case here
it turns out that ΔE Q = +1.86 mms and thus V zz is also positive. In the case of a
negative quadrupole splitting one would observe a mirror image of the trace shown
in Fig. 4.16c with the broad double line feature being in the negative velocity range.
Collins was the first who reported these effects and thus sometimes such diamagnetic
high field Mössbauer spectra are also called “Collins-type” Mössbauer spectra [67].
The addition of histamine (Hm) to NP2 causes very different signatures of the
Mössbauer spectra as displayed in Fig. 4.16d–f. In contrast to the well-defined doublet
of NP2–NO a rather unstructured magnetic pattern is observed at a low field of
30 mT. In such a case it is of advantage to have information about the spin state of the
heme histamine unit from other methods like electron paramagnetic resonance (EPR)
spectroscopy. EPR spectroscopy performed at X-band frequency (~9.4–9.6 GHz)
clearly shows that NP2-Hm has a spin state of S = 1/2 with an anisotropic g-Tensor
↔
g = (1.52, 2.24, 2.92). If we now look at the electronic spin Hamiltonian given in
Eq. 4.1 we can deduct the following information: Since NP2-Hm has S = 1/2 it
cannot have a zero field splitting D and a rhombicity parameter E/D. This simplifies
the spin Hamiltonian considerably and what is left of Eq. 4.1 is just the electronic
Zeeman-Term
ˆ
H S=1/2 = μ B
S ·
↔
g ·
B
(4.11)