

2 Synchrotron-Radiation-Based Energy-Domain Mössbauer …
91
2.4.3.3 Interpretation of Time Spectrum of Quasielastic Scattering
from Space–Time Diagram
We consider why the interference of γ-rays disappears with a time using the space–
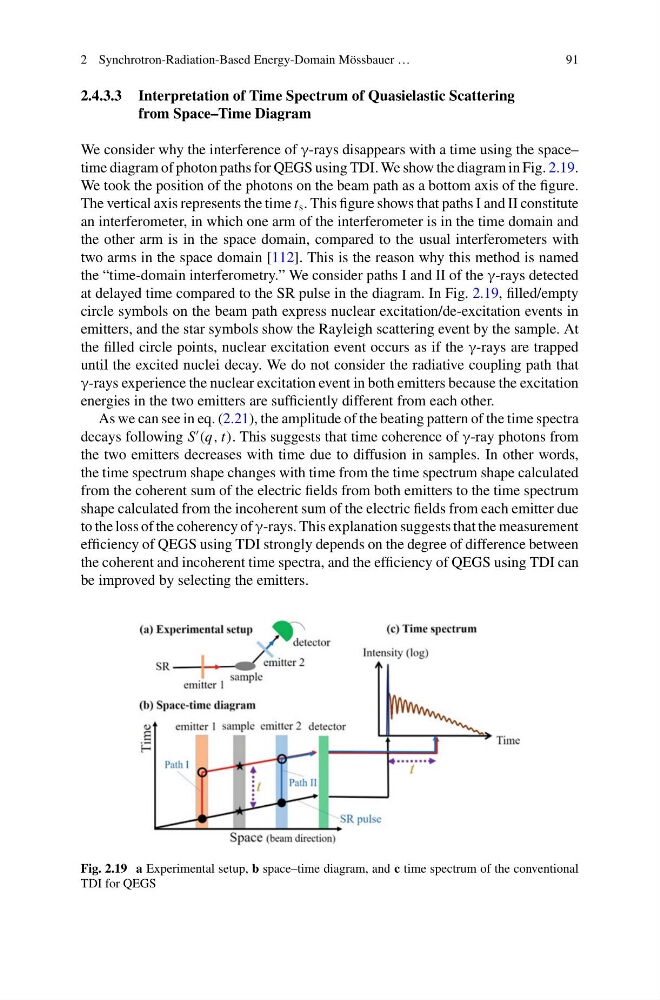
time diagram of photon paths for QEGS using TDI. We show the diagram in Fig. 2.19.
We took the position of the photons on the beam path as a bottom axis of the figure.
The vertical axis represents the time t s . This figure shows that paths I and II constitute
an interferometer, in which one arm of the interferometer is in the time domain and
the other arm is in the space domain, compared to the usual interferometers with
two arms in the space domain [112]. This is the reason why this method is named
the “time-domain interferometry.” We consider paths I and II of the γ-rays detected
at delayed time compared to the SR pulse in the diagram. In Fig. 2.19, filled/empty
circle symbols on the beam path express nuclear excitation/de-excitation events in
emitters, and the star symbols show the Rayleigh scattering event by the sample. At
the filled circle points, nuclear excitation event occurs as if the γ-rays are trapped
until the excited nuclei decay. We do not consider the radiative coupling path that
γ-rays experience the nuclear excitation event in both emitters because the excitation
energies in the two emitters are sufficiently different from each other.
As we can see in eq. (2.21), the amplitude of the beating pattern of the time spectra
decays following S
(q, t). This suggests that time coherence of γ-ray photons from
the two emitters decreases with time due to diffusion in samples. In other words,
the time spectrum shape changes with time from the time spectrum shape calculated
from the coherent sum of the electric fields from both emitters to the time spectrum
shape calculated from the incoherent sum of the electric fields from each emitter due
to the loss of the coherency of γ-rays. This explanation suggests that the measurement
efficiency of QEGS using TDI strongly depends on the degree of difference between
the coherent and incoherent time spectra, and the efficiency of QEGS using TDI can
be improved by selecting the emitters.
Fig. 2.19 a Experimental setup, b space–time diagram, and c time spectrum of the conventional
TDI for QEGS
91
2.4.3.3 Interpretation of Time Spectrum of Quasielastic Scattering
from Space–Time Diagram
We consider why the interference of γ-rays disappears with a time using the space–
time diagram of photon paths for QEGS using TDI. We show the diagram in Fig. 2.19.
We took the position of the photons on the beam path as a bottom axis of the figure.
The vertical axis represents the time t s . This figure shows that paths I and II constitute
an interferometer, in which one arm of the interferometer is in the time domain and
the other arm is in the space domain, compared to the usual interferometers with
two arms in the space domain [112]. This is the reason why this method is named
the “time-domain interferometry.” We consider paths I and II of the γ-rays detected
at delayed time compared to the SR pulse in the diagram. In Fig. 2.19, filled/empty
circle symbols on the beam path express nuclear excitation/de-excitation events in
emitters, and the star symbols show the Rayleigh scattering event by the sample. At
the filled circle points, nuclear excitation event occurs as if the γ-rays are trapped
until the excited nuclei decay. We do not consider the radiative coupling path that
γ-rays experience the nuclear excitation event in both emitters because the excitation
energies in the two emitters are sufficiently different from each other.
As we can see in eq. (2.21), the amplitude of the beating pattern of the time spectra
decays following S
(q, t). This suggests that time coherence of γ-ray photons from
the two emitters decreases with time due to diffusion in samples. In other words,
the time spectrum shape changes with time from the time spectrum shape calculated
from the coherent sum of the electric fields from both emitters to the time spectrum
shape calculated from the incoherent sum of the electric fields from each emitter due
to the loss of the coherency of γ-rays. This explanation suggests that the measurement
efficiency of QEGS using TDI strongly depends on the degree of difference between
the coherent and incoherent time spectra, and the efficiency of QEGS using TDI can
be improved by selecting the emitters.
Fig. 2.19 a Experimental setup, b space–time diagram, and c time spectrum of the conventional
TDI for QEGS