

2 Comprehensive Electrochemistry of Tc …
15
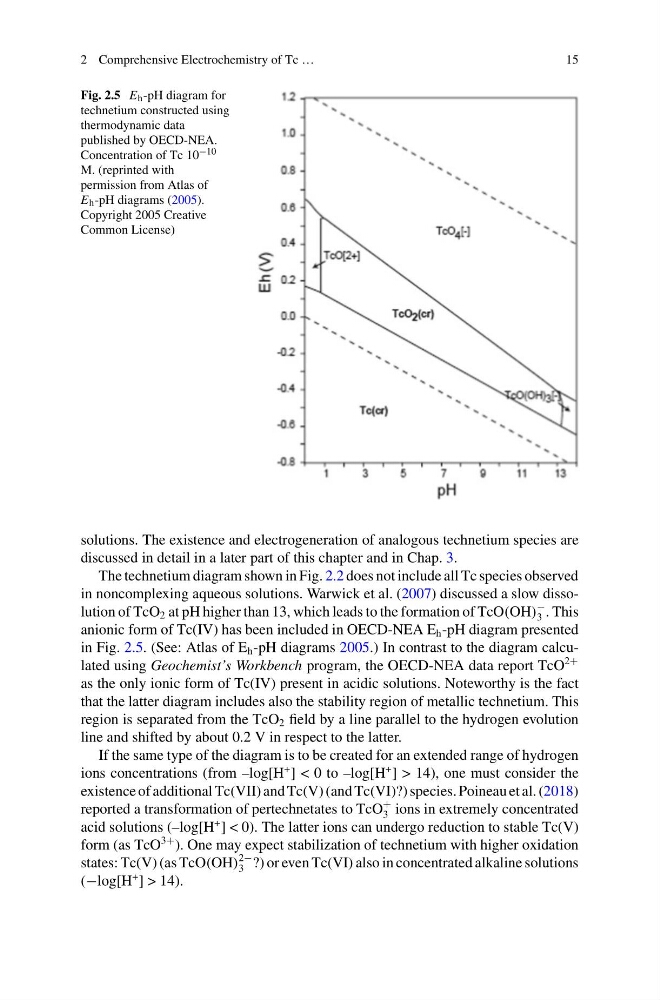
Fig. 2.5 E h -pH diagram for
technetium constructed using
thermodynamic data
published by OECD-NEA.
Concentration of Tc 10 −10
M. (reprinted with
permission from Atlas of
E h -pH diagrams (2005).
Copyright 2005 Creative
Common License)
solutions. The existence and electrogeneration of analogous technetium species are
discussed in detail in a later part of this chapter and in Chap. 3.
The technetium diagram shown in Fig. 2.2 does not include all Tc species observed
in noncomplexing aqueous solutions. Warwick et al. (2007) discussed a slow dissolution of TcO 2 at pH higher than 13, which leads to the formation of TcO(OH)
−
3 . This
anionic form of Tc(IV) has been included in OECD-NEA E h -pH diagram presented
in Fig. 2.5. (See: Atlas of E h -pH diagrams 2005.) In contrast to the diagram calculated using Geochemist’s Workbench program, the OECD-NEA data report TcO
2+
as the only ionic form of Tc(IV) present in acidic solutions. Noteworthy is the fact
that the latter diagram includes also the stability region of metallic technetium. This
region is separated from the TcO 2 field by a line parallel to the hydrogen evolution
line and shifted by about 0.2 V in respect to the latter.
If the same type of the diagram is to be created for an extended range of hydrogen
ions concentrations (from –log[H
+ ] < 0 to –log[H
+ ] > 14), one must consider the
existence of additional Tc(VII) and Tc(V) (and Tc(VI)?) species. Poineau et al. (2018)
reported a transformation of pertechnetates to TcO
+
3 ions in extremely concentrated
acid solutions (–log[H
+ ] < 0). The latter ions can undergo reduction to stable Tc(V)
form (as TcO
3+ ). One may expect stabilization of technetium with higher oxidation
states: Tc(V) (as TcO(OH)
2−
3 ?) or even Tc(VI) also in concentrated alkaline solutions
(−log[H
+ ] > 14).
15
Fig. 2.5 E h -pH diagram for
technetium constructed using
thermodynamic data
published by OECD-NEA.
Concentration of Tc 10 −10
M. (reprinted with
permission from Atlas of
E h -pH diagrams (2005).
Copyright 2005 Creative
Common License)
solutions. The existence and electrogeneration of analogous technetium species are
discussed in detail in a later part of this chapter and in Chap. 3.
The technetium diagram shown in Fig. 2.2 does not include all Tc species observed
in noncomplexing aqueous solutions. Warwick et al. (2007) discussed a slow dissolution of TcO 2 at pH higher than 13, which leads to the formation of TcO(OH)
−
3 . This
anionic form of Tc(IV) has been included in OECD-NEA E h -pH diagram presented
in Fig. 2.5. (See: Atlas of E h -pH diagrams 2005.) In contrast to the diagram calculated using Geochemist’s Workbench program, the OECD-NEA data report TcO
2+
as the only ionic form of Tc(IV) present in acidic solutions. Noteworthy is the fact
that the latter diagram includes also the stability region of metallic technetium. This
region is separated from the TcO 2 field by a line parallel to the hydrogen evolution
line and shifted by about 0.2 V in respect to the latter.
If the same type of the diagram is to be created for an extended range of hydrogen
ions concentrations (from –log[H
+ ] < 0 to –log[H
+ ] > 14), one must consider the
existence of additional Tc(VII) and Tc(V) (and Tc(VI)?) species. Poineau et al. (2018)
reported a transformation of pertechnetates to TcO
+
3 ions in extremely concentrated
acid solutions (–log[H
+ ] < 0). The latter ions can undergo reduction to stable Tc(V)
form (as TcO
3+ ). One may expect stabilization of technetium with higher oxidation
states: Tc(V) (as TcO(OH)
2−
3 ?) or even Tc(VI) also in concentrated alkaline solutions
(−log[H
+ ] > 14).