

A Flow Study in the Cyclone with Particle Separations
57
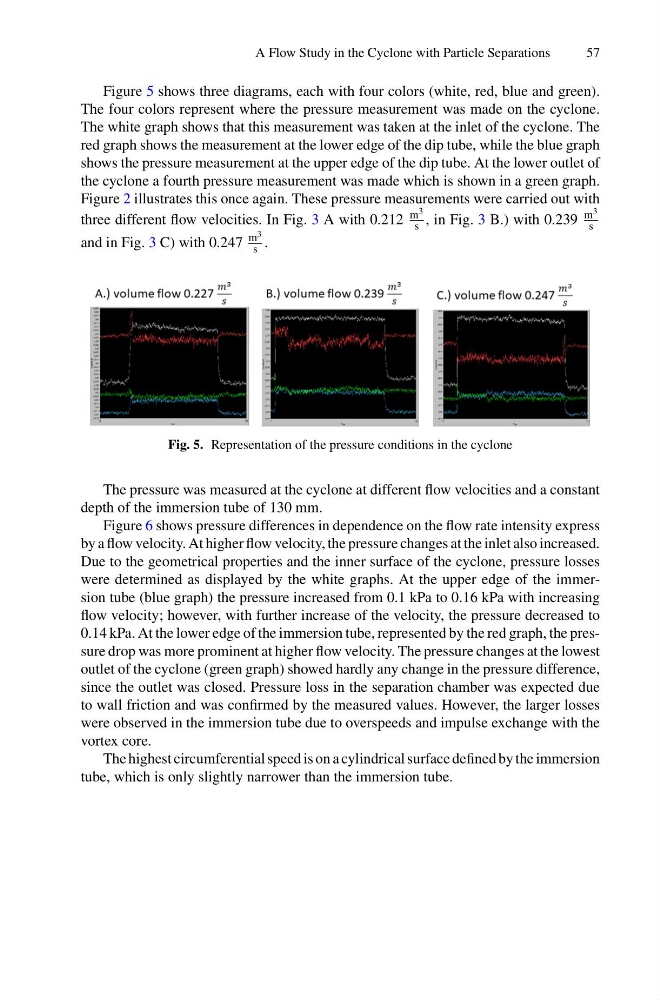
Figure 5 shows three diagrams, each with four colors (white, red, blue and green).
The four colors represent where the pressure measurement was made on the cyclone.
The white graph shows that this measurement was taken at the inlet of the cyclone. The
red graph shows the measurement at the lower edge of the dip tube, while the blue graph
shows the pressure measurement at the upper edge of the dip tube. At the lower outlet of
the cyclone a fourth pressure measurement was made which is shown in a green graph.
Figure 2 illustrates this once again. These pressure measurements were carried out with
three different flow velocities. In Fig. 3 A with 0.212
m 3
s , in Fig. 3 B.) with 0.239
m 3
s
and in Fig. 3 C) with 0.247
m 3
s .
Fig. 5. Representation of the pressure conditions in the cyclone
The pressure was measured at the cyclone at different flow velocities and a constant
depth of the immersion tube of 130 mm.
Figure 6 shows pressure differences in dependence on the flow rate intensity express
by a flow velocity. At higher flow velocity, the pressure changes at the inlet also increased.
Due to the geometrical properties and the inner surface of the cyclone, pressure losses
were determined as displayed by the white graphs. At the upper edge of the immersion tube (blue graph) the pressure increased from 0.1 kPa to 0.16 kPa with increasing
flow velocity; however, with further increase of the velocity, the pressure decreased to
0.14 kPa. At the lower edge of the immersion tube, represented by the red graph, the pressure drop was more prominent at higher flow velocity. The pressure changes at the lowest
outlet of the cyclone (green graph) showed hardly any change in the pressure difference,
since the outlet was closed. Pressure loss in the separation chamber was expected due
to wall friction and was confirmed by the measured values. However, the larger losses
were observed in the immersion tube due to overspeeds and impulse exchange with the
vortex core.
The highest circumferential speed is on a cylindrical surface defined by the immersion
tube, which is only slightly narrower than the immersion tube.
57
Figure 5 shows three diagrams, each with four colors (white, red, blue and green).
The four colors represent where the pressure measurement was made on the cyclone.
The white graph shows that this measurement was taken at the inlet of the cyclone. The
red graph shows the measurement at the lower edge of the dip tube, while the blue graph
shows the pressure measurement at the upper edge of the dip tube. At the lower outlet of
the cyclone a fourth pressure measurement was made which is shown in a green graph.
Figure 2 illustrates this once again. These pressure measurements were carried out with
three different flow velocities. In Fig. 3 A with 0.212
m 3
s , in Fig. 3 B.) with 0.239
m 3
s
and in Fig. 3 C) with 0.247
m 3
s .
Fig. 5. Representation of the pressure conditions in the cyclone
The pressure was measured at the cyclone at different flow velocities and a constant
depth of the immersion tube of 130 mm.
Figure 6 shows pressure differences in dependence on the flow rate intensity express
by a flow velocity. At higher flow velocity, the pressure changes at the inlet also increased.
Due to the geometrical properties and the inner surface of the cyclone, pressure losses
were determined as displayed by the white graphs. At the upper edge of the immersion tube (blue graph) the pressure increased from 0.1 kPa to 0.16 kPa with increasing
flow velocity; however, with further increase of the velocity, the pressure decreased to
0.14 kPa. At the lower edge of the immersion tube, represented by the red graph, the pressure drop was more prominent at higher flow velocity. The pressure changes at the lowest
outlet of the cyclone (green graph) showed hardly any change in the pressure difference,
since the outlet was closed. Pressure loss in the separation chamber was expected due
to wall friction and was confirmed by the measured values. However, the larger losses
were observed in the immersion tube due to overspeeds and impulse exchange with the
vortex core.
The highest circumferential speed is on a cylindrical surface defined by the immersion
tube, which is only slightly narrower than the immersion tube.