

A Flow Study in the Cyclone with Particle Separations
55
Art. Nr. 601599). A constant air flow generated by the radial fan was running through
the PVC pipe with a length of 26.3 D (2000 mm) to the cyclone.
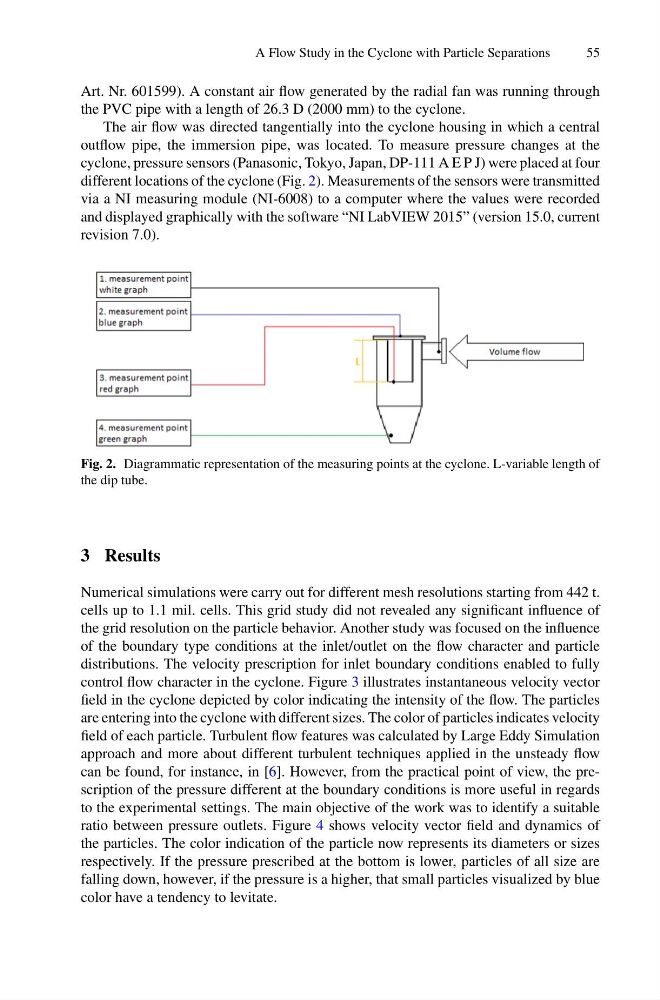
The air flow was directed tangentially into the cyclone housing in which a central
outflow pipe, the immersion pipe, was located. To measure pressure changes at the
cyclone, pressure sensors (Panasonic, Tokyo, Japan, DP-111 A E P J) were placed at four
different locations of the cyclone (Fig. 2). Measurements of the sensors were transmitted
via a NI measuring module (NI-6008) to a computer where the values were recorded
and displayed graphically with the software “NI LabVIEW 2015” (version 15.0, current
revision 7.0).
Fig. 2. Diagrammatic representation of the measuring points at the cyclone. L-variable length of
the dip tube.
3 Results
Numerical simulations were carry out for different mesh resolutions starting from 442 t.
cells up to 1.1 mil. cells. This grid study did not revealed any significant influence of
the grid resolution on the particle behavior. Another study was focused on the influence
of the boundary type conditions at the inlet/outlet on the flow character and particle
distributions. The velocity prescription for inlet boundary conditions enabled to fully
control flow character in the cyclone. Figure 3 illustrates instantaneous velocity vector
field in the cyclone depicted by color indicating the intensity of the flow. The particles
are entering into the cyclone with different sizes. The color of particles indicates velocity
field of each particle. Turbulent flow features was calculated by Large Eddy Simulation
approach and more about different turbulent techniques applied in the unsteady flow
can be found, for instance, in [6]. However, from the practical point of view, the prescription of the pressure different at the boundary conditions is more useful in regards
to the experimental settings. The main objective of the work was to identify a suitable
ratio between pressure outlets. Figure 4 shows velocity vector field and dynamics of
the particles. The color indication of the particle now represents its diameters or sizes
respectively. If the pressure prescribed at the bottom is lower, particles of all size are
falling down, however, if the pressure is a higher, that small particles visualized by blue
color have a tendency to levitate.
55
Art. Nr. 601599). A constant air flow generated by the radial fan was running through
the PVC pipe with a length of 26.3 D (2000 mm) to the cyclone.
The air flow was directed tangentially into the cyclone housing in which a central
outflow pipe, the immersion pipe, was located. To measure pressure changes at the
cyclone, pressure sensors (Panasonic, Tokyo, Japan, DP-111 A E P J) were placed at four
different locations of the cyclone (Fig. 2). Measurements of the sensors were transmitted
via a NI measuring module (NI-6008) to a computer where the values were recorded
and displayed graphically with the software “NI LabVIEW 2015” (version 15.0, current
revision 7.0).
Fig. 2. Diagrammatic representation of the measuring points at the cyclone. L-variable length of
the dip tube.
3 Results
Numerical simulations were carry out for different mesh resolutions starting from 442 t.
cells up to 1.1 mil. cells. This grid study did not revealed any significant influence of
the grid resolution on the particle behavior. Another study was focused on the influence
of the boundary type conditions at the inlet/outlet on the flow character and particle
distributions. The velocity prescription for inlet boundary conditions enabled to fully
control flow character in the cyclone. Figure 3 illustrates instantaneous velocity vector
field in the cyclone depicted by color indicating the intensity of the flow. The particles
are entering into the cyclone with different sizes. The color of particles indicates velocity
field of each particle. Turbulent flow features was calculated by Large Eddy Simulation
approach and more about different turbulent techniques applied in the unsteady flow
can be found, for instance, in [6]. However, from the practical point of view, the prescription of the pressure different at the boundary conditions is more useful in regards
to the experimental settings. The main objective of the work was to identify a suitable
ratio between pressure outlets. Figure 4 shows velocity vector field and dynamics of
the particles. The color indication of the particle now represents its diameters or sizes
respectively. If the pressure prescribed at the bottom is lower, particles of all size are
falling down, however, if the pressure is a higher, that small particles visualized by blue
color have a tendency to levitate.